. 2019 Oct:473:112630.
doi: 10.1016/j.jim.2019.07.002. Epub 2019 Jul 10.

A high-throughput, bead-based, antigen-specific assay to assess the ability of antibodies to induce complement activation

Affiliations

A high-throughput, bead-based, antigen-specific assay to assess the ability of antibodies to induce complement activation

Stephanie Fischinger et al. J Immunol Methods. 2019 Oct.

Abstract

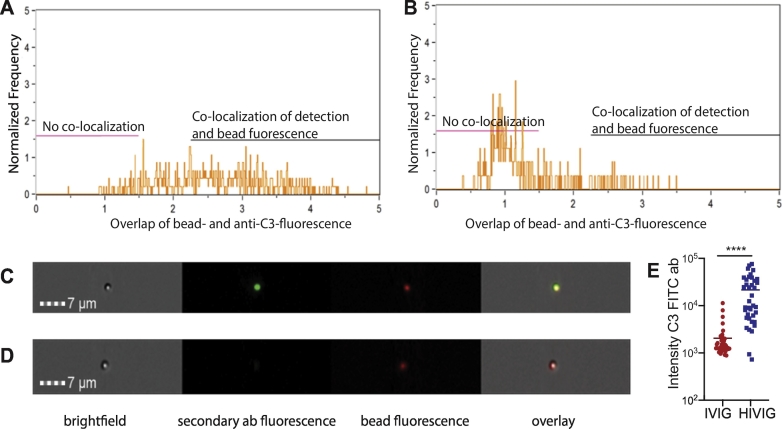
The complement system plays a critical role in innate immune defense against pathogens, both via non-specific direct pathogen recognition and killing or via antigen-specific indirect recruitment by complement fixing antibodies. While various assays for measuring complement activation have been developed, few provide a high-throughput, sample-sparing approach to interrogate the qualitative differences in the ability of antibodies to drive complement activation. Here we present a high-throughput, sample-sparing, bead-based assay to evaluate antigen-specific antibody-dependent complement activation against nearly any antigen. Optimization of buffer composition, kinetics of immune complex formation, as well as complement source all contribute critically to the development of a robust, highly flexible and high-throughput approach to analyze antibody-dependent complement deposition (ADCD). Thus, the optimized bead-based, antigen-specific assay represents a simple, highly adaptable platform to profile antibody-dependent complement activation across pathogens and diseases.

Keywords: ADCD; Antibody-dependent effector function; Complement; Fc receptor; High-throughput.


Figures

Fig. 1
Fig. 1
Antibody- dependent complement deposition assay procedure. A: The classical pathway is activated by C1q binding to immune complexes which causes a conformational change in the C1r:C1s-complex resulting in the activation of the enzymatic activity of C1r. C1r cleaves C1s which leads to cleavage of C4 and C2. C4b and C2b form the C3 convertase which facilitates cleavage of C3 into C3b which is deposited in the pathogen surface and together with C3 convertase forms the C5 convertase leading to cleave of C5. C5b triggers the formation of a pore by recruiting C6, C7, C8 and C9 to form the membrane attach complex (MAC) which leads to disruption of the cell membrane. B: The ADCD assay involves four major steps: First, the biotinylated antigen of interest is incubated with a fluorescent NeutrAvidin-coated bead, then the beads are washed and blocked with PBSA. The antigen-coupled beads are then added to the diluted antibody sample and incubated at 37 °C. After washing the beads, lyophilized guinea pig complement is reconstituted, diluted in veronal buffer, and incubated with the antibody-bead complex at 37 °C. After washing the beads, a FITC-conjugated anti-C3 detection antibody is added. C: Acquisition and flow gating strategy: the unfixed beads are acquired on a flow cytometer equipped with a high throughput sampler (HTS). Gates are drawn on single, red fluorescent particles, and complement deposition is reported as the MFI on the FITC channel.
Fig. 2
Fig. 2
Image stream analysis confirms the detection of complement deposition on fluorescent beads. 5 mg/ml of HIVIG (pooled IgG from HIV-infected individuals as positive control) and IVIG (pooled IgG from healthy individuals as negative control) were used as samples for the detection of complement-activating antibodies against the HIV gp120 antigen. After completing the bead-based complement deposition assay, samples were run on the Amnis ImageStreamX imaging flow cytometer in order to quantify the fluorescence of the fluorescent bead and the detection antibody. The overlay of bead fluorescence and secondary antibody color is depicted in panels A and B. Panels C and D show representative microscopy pictures. A: HIVIG shows a broad overlap of the two fluorescent channels with the spread of co-localization on the x-axis representing the differences in FITC fluorescence. B: IVIG sample shows a low amount of co-localization between bead and secondary antibody fluorescence. C: HIVIG as a sample gives both bead and complement fluorescence, that co-localize as shown in the overlay. D: IVIG does not induce complement deposition on the HIV-bead and therefore only the bead fluorescence is visible. E: Intensity of secondary antibody fluorescence for IVIG and HIVIG for 40 beads is shown. Mann-Whitney test was performed, ****p < 0.0001.
Fig. 3
Fig. 3
Optimization of the bead coupling step and formation of immune complexes. The step of coupling of beads and antigen was optimized by testing 4–5 different conditions each for the ratio of antigen to beads, incubation time of antigen and beads, the amount of beads added per well, and the antibody sample incubation time. Six HIV-positive samples and two HIV-negative samples were tested at a 1:10 dilution for all of the optimization experiments. The histograms show results for the HIV positive sample #2 under the different conditions and the PBS control. Bar graphs indicate mean ± SD of technical duplicates. A–C: Different antigen to bead ratios from 1:4 to 4:1 were tested. D-F: Beads and biotinylated antigen were co-incubated for different time spans: 15 min, 30 min, 1 h and 2 h at 37 °C. G–I: The amount of beads per well was optimized by adding different volumes of the 1:100 bead dilution after coupling and washing to each well. Either 2.5, 5, 10 or 15 μl of a 1:100 bead dilution were added per well. J–L: The incubation time of antigen-coupled beads with antibody sample to form immune complexes was varied from 15 min up to 2 h at 37 °C.
Fig. 4
Fig. 4
Comparison of complement from different species and optimization of the complement incubation step. The ADCD assay was run using human (A, B, and H), guinea pig (C–G, K–M), or rabbit (I–J) complement, together with HIV gp120 as antigen and plasma or purified IgG from HIV-positive and HIV-negative subjects. A different, species-specific detection antibody was used for each source of complement. A, C, I: The histograms indicate results for the 5 mg/ml HIVIG sample using the indicated amounts of complement per well or a PBS control. B, D, J: Line graphs show C3 deposition results over a range of complement amounts, for the indicated HIVIG and IVIG concentrations. Point and error bars indicate mean ± SD of technical triplicates. E: C3 deposition results using 20 μl/well human complement or 4 μl/well guinea pig complement were correlated. Dots represent data for each HIVIG and IVIG concentration tested in panels B and D. F: Bar graph shows the calculated signal (C3 deposition using 5 mg/ml HIVIG) to noise (C3 deposition using 5 mg/ml IVIG) ratios for the indicated amounts of added guinea pig complement. Bars represent the mean ± SD of technical triplicates. The dotted line indicates a signal-to-noise ratio of 1. One way ANOVA was performed on all groups, *p < 0.0332. G: Correlation plot shows the pairwise correlation between four guinea pig complement lot numbers across HIV positive and negative samples. H: Correlation plot depicts comparison of three human plasma donors against four concentrations of HIVIG and IVIG over different amounts of added human plasma as complement source (same set up as in 4B). All correlations were performed as two-tailed Spearman correlations. ****, p < 0.0001 K and L: Histograms depict complement deposition results for an HIV-positive plasma sample with or without prior heatinactivation of the sample, either in the absence (K) or presence (L) of 4 μl/well exogenous guinea pig complement. M: C3 deposition results are shown for HIV-positive and HIV-negative plasma samples tested with or without prior heat-inactivation of the samples, and either with or without 4 μl/well exogenous guinea pig complement. Statistics were performed using a paired t-test. *p > 0.0332. Differences between HI or non-HI sample were not statistically significant by paired t-test.
Fig. 5
Fig. 5
Optimization of the complement incubation step. The ADCD assay was run using HIV gp120-coupled beads, 4 μl/well guinea pig complement, and plasma or purified IgG from HIV-positive and HIV-negative subjects. A–C: The reconstituted complement was diluted in different-test buffers. The histogram (A) shows C3 deposition results for HIV-positive sample #1 or a PBS control together with complement diluted in the indicated buffers. The bar graph (B) shows C3 deposition results using each complement diluent and three HIV-positive plasma samples, one HIV-negative plasma sample, HIVIG, and IVIG. The bar graph in (C) depicts the signal (C3 deposition using 5 mg/ml HIVIG) to noise (C3 deposition using 5 mg/ml IVIG) ratio for the different-test buffers. D–F: Guinea pig complement (4 μl/well, diluted in GVB++) was added to the immune-complexed beads and incubated for different time spans ranging from 15 min to 1 h at 37 °C. The histogram (D) shows results for HIV positive sample #2 for each complement incubation time or PBS control. Graph (E) shows results for six HIV-positive and two HIV-negative plasma samples across complement incubation times. The bar graph (F) depicts the signal (C3 deposition for HIV-positive plasma sample #5) to noise (C3 deposition for HIV-negative plasma sample #2 for each complement incubation time. G–I: After complement incubation, the impact of different EDTA concentrations in the wash buffer was investigated against PBS washes. The histogram (G) shows the C3 deposition results with a PBS control sample or 5 mg/ml HIVIG for each washing condition. Graph (H) shows the C3 deposition results for 1.25–5 mg/ml HIVIG or IVIG sample for each test wash buffer. The bar graph (I) depicts the signal (C3 deposition for 5 mg/ml HIVIG) to noise (C3 deposition for 5 mg/ml IVIG) ratios for each assay wash buffer. J–L: The short-term stability of reconstituted guinea pig complement was tested in the ADCD assay. The histogram (J) shows C3 deposition results for PBS control or 5 mg/ml HIVIG sample tested with freshly reconstituted guinea pig complement or complement that had been reconstituted 3 h earlier and stored at 4 °C. Graph (K) shows extended results from the same experimental setup using HIVIG and IVIG samples. The bar graph (L) depicts the signal (C3 deposition for 5 mg/ml HIVIG) to noise (C3 deposition for 5 mg/ml IVIG) ratios for each assay condition. Differences in results between using freshly-reconstituted or 3 h-old complement were not statistically significant by t-test (L). For all analyses, a one-way ANOVA was used to compared differences across >2 groups and a paired t-test was used to test differences across 2 groups. *p < 0.05, **p < 0.005, ***p < 0.0005.
Fig. 6
Fig. 6
Assessment of the versatility and reproducibility of the ADCD assay. A-C: The ADCD assay was tested for versatility by comparing plasma and serum samples prepared from the same whole blood draws from 8 HIV-positive and 2 HIV-negative individuals. These samples were tested using the standard assay protocol, HIV gp120-coupled beads, a 1:10 sample dilution, and guinea pig complement. Shown are (A) the individual C3 deposition results for each test sample and (B) the correlation of C3 deposition results for plasma versus serum samples from each subject. Additional assay plates were set up in parallel using the same plasma samples, the beads were either resuspended in PBS or fixed with 4% PFA at the end of the assay, and then the beads were acquired on a flow cytometer on the day of the assay (Day 0) or up to 7 days later. (C) The correlation of C3 deposition results for each assay condition and time point are shown versus unfixed beads acquired on Day 0. D–F: A sample set of 27 HIV-positive samples was tested against an (D) influenza HA antigen (H1N1, California, 2009) and (E) HIV gp120 antigen (YU2). Bars indicate mean ± SD of technical replicates, and dotted line represents assay background (PBS control). The correlation of C3 deposition results for the sample set for HIV gp120 and influenza HA antigens is shown in (F). G: Two independent operators tested 10 HIV-positive and 2 HIV-negative plasma samples in the ADCD assay using HIV gp120-coupled beads. The correlation of C3 deposition results obtained between operators is shown in (G). H: A single operator tested 9 HIV-positive and 2 HIV-negative plasma samples in the ADCD assay using HIV gp120-coupled beads twice on separate days. The correlation of C3 deposition results obtained between the two assay runs is shown in (H). For all analyses, a one-way ANOVA was used to compared differences across >2 groups, a paired t-test was used to test differences across 2 groups, and correlations were assessed using a two-tailed Spearman correlation: ***p < 0.0005, ****p < 0.0001.
Supplemental Fig. S1
Comparison of different complement anti-C3 detection antibodies. The correlation plot depicts the complement deposition assay results using FITC-conjugated monoclonal anti-human C3/C3b/iC3b, monoclonal anti-human C3d, and polyclonal anti-C3 antibodies. Human plasma (20 μl/well) was used as a complement source together with HIV gp120-coupled beads and 0.5–5.0 mg/ml HIVIG or IVIG sample. Correlations were performed using a two-tailed Spearman correlation; ***, p < 0.0005, ****, p < 0.0001.
Supplemental Fig. S2
C3/C4-deficient plasma does not elicit complement deposition. Active and C4-deficient guinea pig complement (4 μl/well) as well as active and C3-deficient human complement (20 μl/well) were tested in the ADCD assay with HIV gp120-coupled beads and 0.5–2.0 mg/ml HIVIG or IVIG sample. A FITC-conjugated, species-specific detection antibody was used for each complement source. The paired Wilcoxon test was performed, *p < 0.0332.

References

    1. Ackerman M.E., Moldt B., Wyatt R.T., Dugast A.S., McAndrew E., Tsoukas S., Jost S., Berger C.T., Sciaranghella G., Liu Q., Irvine D.J., Burton D.R., Alter G. A robust, high-throughput assay to determine the phagocytic activity of clinical antibody samples. J. Immunol. Methods. 2011 - PMC - PubMed
    1. Ayoglu B., Szarka E., Huber K., Orosz A., Babos F., Magyar A., Hudecz F., Rojkovich B., Gáti T., Nagy G., Schwenk J.M., Sármay G., Prechl J., Nilsson P., Papp K. Bead arrays for antibody and complement profiling reveal joint contribution of antibody isotypes to C3 deposition. PLoS One. 2014;9 - PMC - PubMed
    1. Ballanti E., Perricone C., Greco E., Ballanti M., Di Muzio G., Chimenti M.S., Perricone R. Complement and autoimmunity. Immunol. Res. 2013;56:477–491. - PubMed
    1. Bánki Z., Stoiber H., Dierich M.P. HIV and human complement: inefficient virolysis and effective adherence. Immunol. Lett. 2005 - PubMed
    1. Bash M.C., Lynn F., Mocca B., Borrow R., Findlow H., Hassan-King M., Preziosi M.P., Idoko O., Sow S., Kulkarni P., LaForce F.M. Development and use of a serum bactericidal assay using pooled human complement to assess responses to a meningococcal group a conjugate vaccine in African toddlers. Clin. Vaccine Immunol. 2014 - PMC - PubMed

Publication types