. 2019 Nov 5:373:112080.
doi: 10.1016/j.bbr.2019.112080. Epub 2019 Jul 10.

Effects of vagus nerve stimulation are mediated in part by TrkB in a parkinson's disease model

Affiliations

Effects of vagus nerve stimulation are mediated in part by TrkB in a parkinson's disease model

Ariana Q Farrand et al. Behav Brain Res. .

Abstract

Vagus nerve stimulation (VNS) is being explored as a potential therapeutic for Parkinson's disease (PD). VNS is less invasive than other surgical treatments and has beneficial effects on behavior and brain pathology. It has been suggested that VNS exerts these effects by increasing brain-derived neurotrophic factor (BDNF) to enhance pro-survival mechanisms of its receptor, tropomyosin receptor kinase-B (TrkB). We have previously shown that striatal BDNF is increased after VNS in a lesion model of PD. By chronically administering ANA-12, a TrkB-specific antagonist, we aimed to determine TrkB's role in beneficial VNS effects for a PD model. In this study, we administered a noradrenergic neurotoxin, DSP-4, intraperitoneally and one week later administered a bilateral intrastriatal dopaminergic neurotoxin, 6-OHDA. At this time, the left vagus nerve was cuffed for stimulation. Eleven days later, rats received VNS twice per day for ten days, with daily locomotor assessment. Daily ANA-12 injections were given one hour prior to the afternoon stimulation and concurrent locomotor session. Following the final VNS session, rats were euthanized, and left striatum, bilateral substantia nigra and locus coeruleus were sectioned for immunohistochemical detection of neurons, α-synuclein, astrocytes, and microglia. While ANA-12 did not avert behavioral improvements of VNS, and only partially prevented VNS-induced attenuation of neuronal loss in the locus coeruleus, it did stop neuronal and anti-inflammatory effects of VNS in the nigrostriatal system, indicating a role for TrkB in mediating VNS efficacy. However, our data also suggest that BDNF-TrkB is not the sole mechanism of action for VNS in PD.

Keywords: Brain-derived neurotrophic factor; Dopamine; Norepinephrine; Parkinson’s disease; Tropomyosin receptor kinase B; Vagus nerve stimulation.


Conflict of interest statement

Declarations of Interest: none

Figures

Fig. 1.
Fig. 1.. Experimental design timeline.
Rats received either saline (0.9% sodium chloride) or DSP-4 (50 mg/kg, intraperitoneal) to induce noradrenergic lesion. After 7 days, rats had surgery to implant the vagus cuff and headcap and to induce striatal dopaminergic lesion with 6-OHDA (6 μg/μL, 2 μL/site). After allowing 11 days for lesion development, rats began two VNS sessions per day for 10 days. Additionally, rats received either vehicle (17% DMSO in saline) or ANA-12 (0.5 mg/kg, intraperitoneal) 1 h prior to the afternoon VNS session. Locomotor activity (LA) of all rats was assessed for the first 10 min of the PM VNS session each day for all 10 days of stimulation. After the locomotor assessment on day 10, rats were euthanized so that brains could be processed for immunohistochemistry (IHC).
Fig. 2.
Fig. 2.. ANA-12 did not block VNS-induced locomotor activity increase.
Total distance was measured in cm across all 10 days of VNS, and locomotor activity was consistently lower in lesion nonVNS rats compared to saline nonVNS rats (A). Total distances were averaged for each animal to give an average distance traveled (B). Lesion nonVNS vehicle rats move significantly less than saline nonVNS vehicle rats (**p < 0.01), and there was a trend toward increase in lesion +VNS rats compared to lesion nonVNS (p = 0.052). While ANA-12 reduced locomotor activity in saline nonVNS rats (*p < 0.05), other groups’ locomotion was unaffected by ANA-12 administration.
Fig. 3.
Fig. 3.. ANA-12 partially prevented VNS-induced attenuation of TH-positive LC loss.
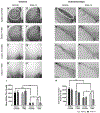
Photomicrographs of LC (A-H, scale = 100 μm, quantified in I), measurement outline shown in A. TH-positive cells were significantly lower in the LC of lesion nonVNS vehicle rats compared to saline nonVNS vehicle rats (A, C, ****p < 0.0001). Saline vehicle treated rats had increased TH-positive cells after VNS (A-B, **p < 0.01), and lesion +VNS vehicle rats had greater TH-positive cells than lesion nonVNS vehicle rats (C–D, ****p < 0.0001). Administration of ANA-12 resulted in fewer TH-positive neurons for the lesion +VNS group (D, H, ****p < 0.0001), although numbers were still higher for the lesion +VNS ANA-12 rats compared to the lesion nonVNS ANA-12 rats (G-H, **p < 0.01). ANA-12 did not alter LC TH-positive neurons for the saline nonVNS, saline +VNS, or lesion nonVNS groups (A–C, E–G).
Fig. 4.
Fig. 4.. Attenuation of nigrostriatal loss by VNS was prevented with ANA-12.
Measurement outlines are shown for the striatum (A) and SN (J). Photomicrographs of striatum are shown in A-H (scale = 500 μm, quantified in I). Saline treated rats had comparative TH-ir across treatment groups (A-B, E-F). TH-ir was significantly lower in lesion nonVNS vehicle rats compared to saline nonVNS vehicle rats (A, C, ****p < 0.0001). Lesion +VNS vehicle rats had greater TH-ir than lesion nonVNS vehicle rats (C-D, *p < 0.05), though this was only a partial increase compared to saline +VNS vehicle rats (B, D, **p < 0.01). This VNS effect was prevented with ANA-12 in the lesion +VNS group (D, H, *p < 0.05). Photomicrographs of SN are shown in J-Q (scale = 250 μm, quantified in R). Lesion nonVNS vehicle rats had significantly fewer TH-positive cells than saline nonVNS vehicle rats (J, L, ****p < 0.0001). Lesion +VNS vehicle rats had increased TH-positive cells compared to lesion nonVNS vehicle rats (L-M, **p < 0.01). TH-positive cells in the SN of lesion +VNS vehicle rats remained lower than saline +VNS vehicle rats (K, M, *p < 0.05). ANA-12 administration resulted in fewer TH-positive cells for lesion +VNS rats only (M, Q, ****p < 0.0001).
Fig. 5.
Fig. 5.. ANA-12 increased intrasomal α-synuclein in remaining SN-DA neurons.
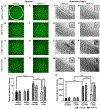
Confocal z-stacks of TH-positive cells (red) are overlayed with α-synuclein (green) (A-H, scale = 25 μm, quantified in I). Insets show α-synuclein within a single representative TH-positive neuron from each group. Lesion nonVNS vehicle rats have higher intracellular α-synuclein density than saline nonVNS vehicle rats (A-B, C, G, ****p < 0.0001). VNS alone did not alter intracellular α-synuclein density (A-B), but reduced intracellular α-synuclein density in lesion vehicle rats (C-D, ***p < 0.001). ANA-12 increased intracellular α-synuclein density in both saline nonVNS and saline +VNS rats (A-B, E-F, **p < 0.01), though saline nonVNS ANA-12 rats still had lower levels than lesion nonVNS ANA-12 rats (*p < 0.05), and ANA-12 prevented the effects of VNS on intracellular α-synuclein density in lesioned rats (D, H, ****p < 0.0001).
Fig. 6.
Fig. 6.. Effects of VNS on microglia are prevented with ANA-12 in the striatum and SN.
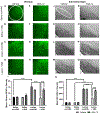
White circles denote ROI measurement for the striatum (A) and SN (J). Photomicrographs of dorsal striatum are shown in A-H (scale = 100 μm, quantified in I). Lesion nonVNS vehicle rats had increased striatal Iba-1-ir compared to saline nonVNS vehicle rats (A, C, ****p < 0.0001). Striatal Iba-1-ir was similar in saline +VNS vehicle compared to saline nonVNS vehicle rats (A–B), while striatal Iba-1-ir was lower in lesion +VNS vehicle rats compared to lesion nonVNS vehicle rats (C-D, ***p < 0.001). Striatal Iba-1-ir was increased after ANA-12 in lesion +VNS rats only (E–H, *p < 0.05). Photomicrographs of the SN are shown in J-Q (scale = 250 μm, insets taken at 60x, quantified in R). Lesion nonVNS vehicle rats had increased Iba-1-ir in the SN compared to saline nonVNS vehicle rats (J, L, ****p < 0.01). SN Iba-1-ir was similar after VNS in saline rats (J-K) while Iba-1-ir was lower in lesion +VNS vehicle rats compared to lesion nonVNS vehicle rats (L-M, ****p < 0.0001), although lesion +VNS vehicle rats still had increased Iba-1-ir compared to saline +VNS vehicle rats (****p < 0.0001). ANA-12 prevented the SN Iba-1-ir decrease after VNS in lesion rats (M, Q, ****p < 0.0001), and ANA-12 did not alter Iba-1-ir in any other treatment groups (J–L, N–O). Insets demonstrate primarily resting state microglia in saline groups and the lesion +VNS vehicle group (J–K, M–O insets); however, in lesion nonVNS and lesion +VNS ANA-12 rats, most microglia appear to be in an activated state (L, P–Q insets).
Fig. 7.
Fig. 7.. ANA-12 prevented effects of VNS on astrocytes in striatum and SN.
Measurement outlines are shown for the striatum (A) and SN (J). Photomicrographs of dorsal striatum are shown in A-H (scale = 100 μm, quantified in I). Lesion nonVNS vehicle rats had increased striatal GFAP-ir compared to saline nonVNS vehicle rats (A, C, ****p < 0.0001). Striatal GFAP-ir was similar in saline +VNS vehicle compared to saline nonVNS vehicle rats (A–B), while striatal GFAP-ir was lower in lesion +VNS vehicle rats compared to lesion nonVNS vehicle rats (C–D, ****p < 0.0001). Striatal GFAP-ir was increased after ANA-12 in lesion +VNS rats only (E–H, ****p < 0.0001). Photomicrographs of the SN are shown in J–Q (scale = 250 μm, quantified in R). Lesion nonVNS vehicle rats had increased GFAP-ir in the SN compared to saline nonVNS vehicle rats (J, L, ****p < 0.01). SN GFAP-ir was similar after VNS in saline rats (J-K) while GFAP-ir was lower in lesion +VNS vehicle rats compared to lesion nonVNS vehicle rats (L-M, ****p < 0.0001), although lesion +VNS vehicle rats still had increased GFAP-ir compared to saline +VNS vehicle rats (****p < 0.0001). ANA-12 prevented the effects of VNS in the lesion rats for the SN (M, Q, ****p < 0.0001), and ANA-12 did not alter GFAP-ir in any other treatment groups (J–L, N–P).

Similar articles

Cited by

References

    1. Tysnes OB, & Storstein A (2017). Epidemiology of Parkinson’s disease. J Neural Transm (Vienna), 124(8), 901–905. doi: 10.1007/s00702-017-1686-y - DOI - PubMed
    1. Holmqvist S, Chutna O, Bousset L, Aldrin-Kirk P, Li W, Bjorklund T, … Li JY (2014). Direct evidence of Parkinson pathology spread from the gastrointestinal tract to the brain in rats. Acta Neuropathol, 128(6), 805–820. doi: 10.1007/s00401-014-1343-6 - DOI - PubMed
    1. Marras C (2015). Subtypes of Parkinson’s disease: state of the field and future directions. Curr Opin Neurol, 28(4),382–386. doi: 10.1097/WCO.0000000000000219 - DOI - PubMed
    1. Wang C, Tan JM, Ho MW, Zaiden N, Wong SH, Chew CL, … Lim KL (2005). Alterations in the solubility and intracellular localization of parkin by several familial Parkinson’s disease-linked point mutations. J Neurochem, 93(2), 422–431. doi: 10.1111/j.1471-4159.2005.03023.x - DOI - PubMed
    1. Kalia LV, & Lang AE (2015). Parkinson’s disease. Lancet, 386(9996), 896912. doi: 10.1016/S0140-6736(14)61393-3 - DOI - PubMed

Publication types

MeSH terms