. 2019 Oct 1;86(7):557-567.
doi: 10.1016/j.biopsych.2019.05.016. Epub 2019 May 29.

Differential Patterns of Visual Sensory Alteration Underlying Face Emotion Recognition Impairment and Motion Perception Deficits in Schizophrenia and Autism Spectrum Disorder

Affiliations

Differential Patterns of Visual Sensory Alteration Underlying Face Emotion Recognition Impairment and Motion Perception Deficits in Schizophrenia and Autism Spectrum Disorder

Antígona Martínez et al. Biol Psychiatry. .

Abstract

Background: Impaired face emotion recognition (FER) and abnormal motion processing are core features in schizophrenia (SZ) and autism spectrum disorder (ASD) that have been linked to atypical activity within the visual cortex. Despite overlaps, only a few studies have directly explored convergent versus divergent neural mechanisms of altered visual processing in ASD and SZ. We employed a multimodal imaging approach to evaluate FER and motion perception in relation to functioning of subcortical and cortical visual regions.

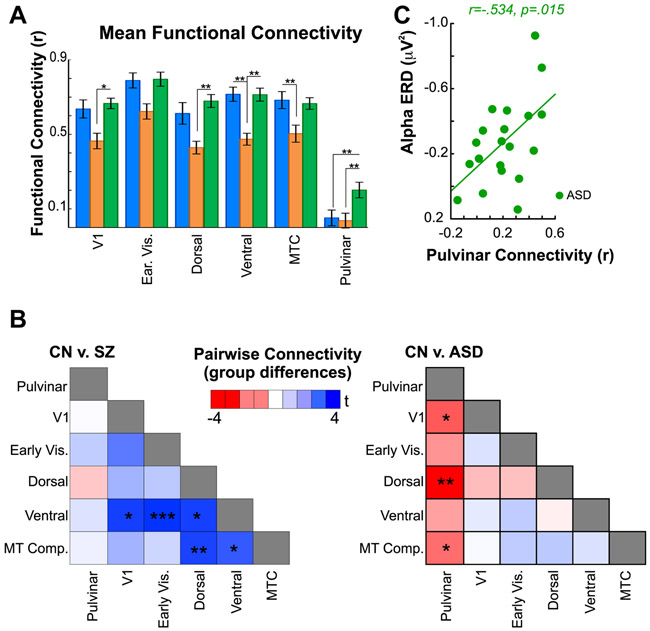
Methods: Subjects were 20 high-functioning adults with ASD, 19 patients with SZ, and 17 control participants. Behavioral measures of coherent motion sensitivity and FER along with electrophysiological and functional magnetic resonance imaging measures of visual pattern and motion processing were obtained. Resting-state functional magnetic resonance imaging was used to assess the relationship between corticocortical and thalamocortical connectivity and atypical visual processing.

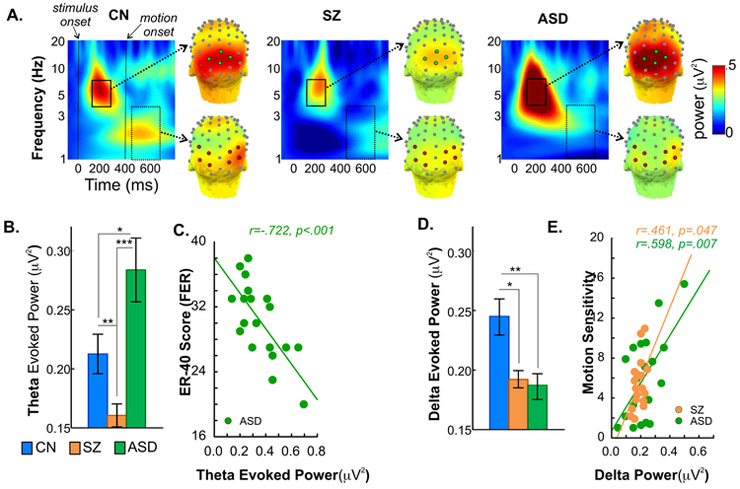
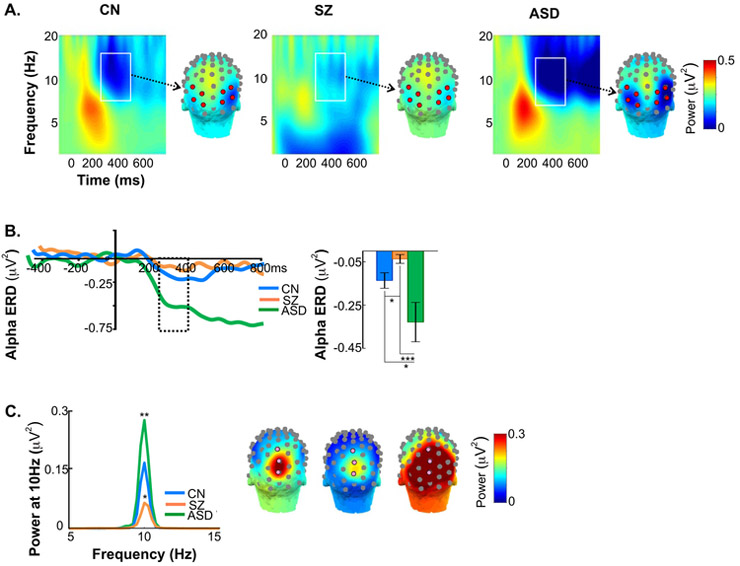
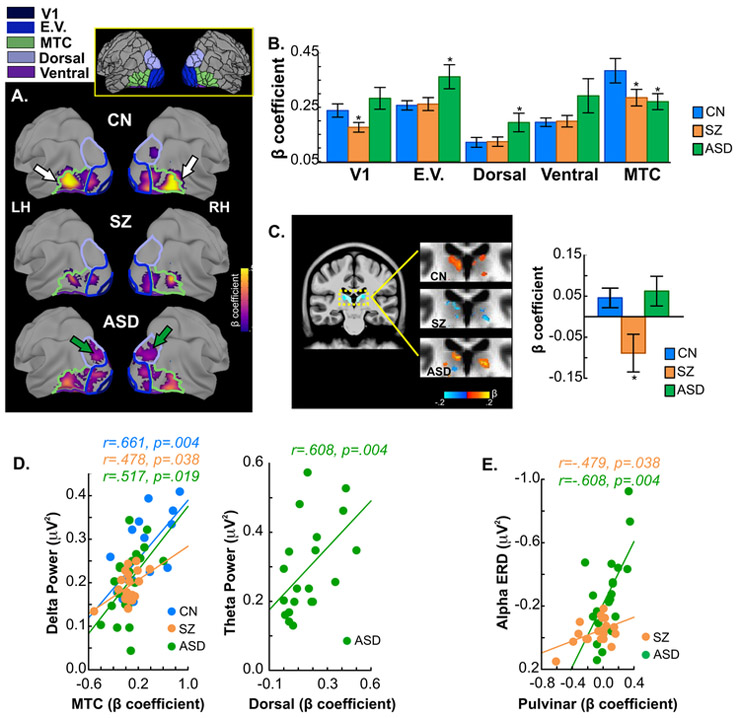
Results: SZ and ASD participants had intercorrelated deficits in FER and motion sensitivity. In both groups, reduced motion sensitivity was associated with reduced functional magnetic resonance imaging activation in the occipitotemporal cortex and lower delta-band electroencephalogram power. In ASD, FER deficits correlated with hyperactivation of dorsal stream regions and increased evoked theta power. Activation of the pulvinar correlated with abnormal alpha-band modulation in SZ and ASD with under- and overmodulation, respectively, predicting increased clinical symptoms in both groups.

Conclusions: SZ and ASD participants showed equivalent deficits in FER and motion sensitivity but markedly different profiles of physiological dysfunction. The specific pattern of deficits observed in each group may help guide development of treatments designed to downregulate versus upregulate visual processing within the respective clinical groups.

Keywords: Autism; EEG; FER; Motion; Schizophrenia; Visual.


Conflict of interest statement

Financial Disclosures

All authors report no biomedical financial interests or potential conflicts of interest.

Figures

Figure 1
Figure 1
A. Time-frequency and scalp topography maps of evoked-power to stimulus and motion onset. Time-frequency plots and scalp topography of mean evoked-power (average of all stimuli) for the control (CN), schizophrenia (SZ) and autism spectrum disorder (ASD) groups. For each stimulus-type, theta power (4-7Hz) was tested during the latency window 150-250ms (solid rectangle) following stimulus onset at time 0 and measured across 4 mid-occipital electrode sites from the specially developed ‘Duke’ system featuring equidistant spacing between electrodes (https://www.ant-neuro.com) (7Z, 8Z, 8L, 8R, green circles). Delta (1-4Hz) activity was tested between 50-250ms (dashed rectangle) interval following the onset of motion (at time 400ms), across 4 bilateral lateral-occipital sites (8L/8R, 5LB/5RB, 9L/9R, 5LC/5RC, red circles). B. Theta evoked-power, group differences. Bar plots of mean theta power (collapsed across stimulus type) for each participant group. Theta activity was significantly lower in SZ patients compared to controls. In contrast, theta was significantly elevated in ASD participants. For this and all figures, asterisks denote statistical significance as follows: p<.001 (***),p<.01 (**),p<.05 (*). C. Correlation of ER-40 scores and theta evoked-power. In ASD participants, enhanced theta activity significantly correlated with impaired face-emotion recognition (FER). This correlation was not significant either in SZ (r=−.36,p=.135) or CN groups (r=−.32,p=.240). D. Delta evoked-power, group differences. Bar plots of mean delta power (collapsed across stimulus type) for each participant group. In contrast to theta, delta power was significantly lower in both SZ and ASD groups, compared to controls. E. Correlation between motion-sensitivity and delta evoked-power. In both clinical groups, reduced delta power correlated with behavioral measures of impaired motion-sensitivity. This correlation was not significant in CN’s (r=.38,p=.131).
Figure 2
Figure 2
A. Single-trial time-frequency histograms and scalp topography maps of event-related desynchronization (ERD) of alpha activity. Time-frequency plots and scalp topography of mean alpha ERD single-trial power for each participant group. Alpha ERD was measured between 7-14Hz over the latency window of 250-400ms post-stimulus onset, (white rectangles) across 4 bilateral lateral-occipital electrodes (8L/8R, 5LB/5RB, 9L/9R, 5LC/5RC, red circles). B. Time-course and amplitude of alpha ERD. In the test interval of 250-400ms (dashed rectangle) ERD amplitude was significantly reduced in SZ compared to CN participants. In contrast, the ERD was enhanced in ASD compared to both SZ and CN groups. ERD enhancement persisted in ASD participants relative to CN and SZ groups. C. Counterphase reversals at 10Hz. Tracings are of group-averaged ssVEP power collapsed across stimulus types and plotted by spectral frequency. Relative to CN’s, ssVEP amplitude was reduced in SZ and enhanced in ASD participants. Asterisks denote significance of the difference between SZ patients and ASD participants compared to CN’s. The ssVEP was tested across 3 mid-occipital electrodes (6Z, 7Z, 8Z).
Figure 3
Figure 3
A. Group-averaged fMRI activation for the contrast of moving versus static stimuli. For each participant group, mean activation is shown on the semi-inflated fsaverage brain. Colored outlines are boundaries of the five cortical regions included in analyses (V1: dark blue; E.V. (Early Visual): blue; Dorsal: purple; Ventral: violet, MTC (MT Complex): green). Each region consists of between 1 and 9 individual parcels (total of 26; see (18) supplement and Supplementary Table 1). Inset shows all parcels (drawn in black) of the HCP-MMP atlas, including the parcels comprising the five regions (colored) from which data was extracted and averaged. Single- participant statistical analyses followed GLM procedures incorporated in AFNI (afni_proc.py). Group differences in activation were evaluated by ANOVA using AFNI’s 3dMVM program. Corrections for multiple comparisons were carried out at the cluster level using Monte Carlo simulation (AFNI’s slow_surf_clustsim.py,p< 0.01, corrected). Arrows (on CN maps) point to the MTC region where activation was significantly higher in CN’s compared to both SZ patients and ASD participants. Green arrows (on ASD maps) point to the dorsal region which showed enhanced activation in ASD participants. B. Mean beta contrast parameter estimates within each region. Asterisks denote regions where activations in SZ or ASD participants differed significantly from that of CN subjects. Activation of the MTC region was reduced in both SZ and ASD participants. These reductions were localized within the MST, MT, LO1 and LO3 parcels of the HCP-MMP atlas. In ASD participants, activation within both early visual and dorsal stream regions was significantly greater compared to both SZ patients and CN participants. The enhanced early visual activations were located within the V2 and V3 parcels and the dorsal stream region with increased activation localized to the V3A parcel. C. Mean activation within the pulvinar nucleus of the thalamus. Subcortically, pulvinar activation was reduced in SZ patients relative to CN’s (dashed rectangle on sagittal slice indicates magnified region shown to the right). D. Correlations with EEG variables. In all participant groups, greater activation within the MTC regions was significantly associated with increased delta evoked-power elicited by the motion onset of all stimuli (left). In ASD participants, enhanced activation of the dorsal region correlated with participants’ abnormally high theta power following stimulus onset (right). E. Correlation of pulvinar activation with alpha ERD. In both SZ patients and ASD participants, the magnitude of pulvinar activation correlated significantly with ERD amplitude. Note vertical scale is reversed to show that such that larger (more negative) alpha ERD is associated with greater pulvinar activation.
Figure 4
Figure 4
A. Resting state functional connectivity. Bar graphs are of mean connectivity between each region and the average of all others. Compared to CN participants, mean rsFC was reduced in SZ patients in the ventral and MTC regions. Compared to ASD participants, SZ patients had reduced rsFC in the V1, dorsal and ventral regions. In contrast, mean rsFC of all cortical regions was equivalent in ASD participants compared to CN’s. Mean rsFC of the pulvinar, however, was significantly greater in ASD subjects relative to both CN’s and SZ patients. B. Group differences in pairwise rsFC. For each participant, rsFC between regions was calculated in a pairwise fashion and entered into between-group (two-tailed) t-tests. Resulting T values are plotted in heatmaps comparing CN’s to SZ patients (left) and CN’s to ASD participants (right). Blue scale denotes greater rsFC in CN’s versus SZ and lower rsFC in CN compared to ASD participants (red scale, thus, denotes greater rsFC in ASD relative to CN’s).

Comment in

Similar articles

Cited by

References

    1. Kohler CG, Walker JB, Martin EA, Healey KM, Moberg PJ (2010): Facial emotion perception in schizophrenia: a meta-analytic review. Schizophr Bull. 36:1009–1019. - PMC - PubMed
    1. Edwards J, Jackson HJ, Pattison PE (2002): Emotion recognition via facial expression and affective prosody in schizophrenia: a methodological review. Clin Psychol Rev. 22:789–832. - PubMed
    1. Corcoran CM, Keilp JG, Kayser J, Klim C, Butler PD, Bruder GE, et al. (2015): Emotion recognition deficits as predictors of transition in individuals at clinical high risk for schizophrenia: a neurodevelopmental perspective. Psychol Med. 45:2959–2973. - PMC - PubMed
    1. Harms MB, Martin A, Wallace GL (2010): Facial emotion recognition in autism spectrum disorders: a review of behavioral and neuroimaging studies. Neuropsychol Rev. 20:290–322. - PubMed
    1. Uljarevic M, Hamilton A (2013): Recognition of emotions in autism: a formal meta-analysis. J Autism Dev Disord. 43:1517–1526. - PubMed

Publication types

MeSH terms