. 2019 Jul 24;9(1):74-92.e8.
doi: 10.1016/j.cels.2019.05.009. Epub 2019 Jul 10.

VISAGE Reveals a Targetable Mitotic Spindle Vulnerability in Cancer Cells

Affiliations

VISAGE Reveals a Targetable Mitotic Spindle Vulnerability in Cancer Cells

Jesse C Patterson et al. Cell Syst. .

Abstract

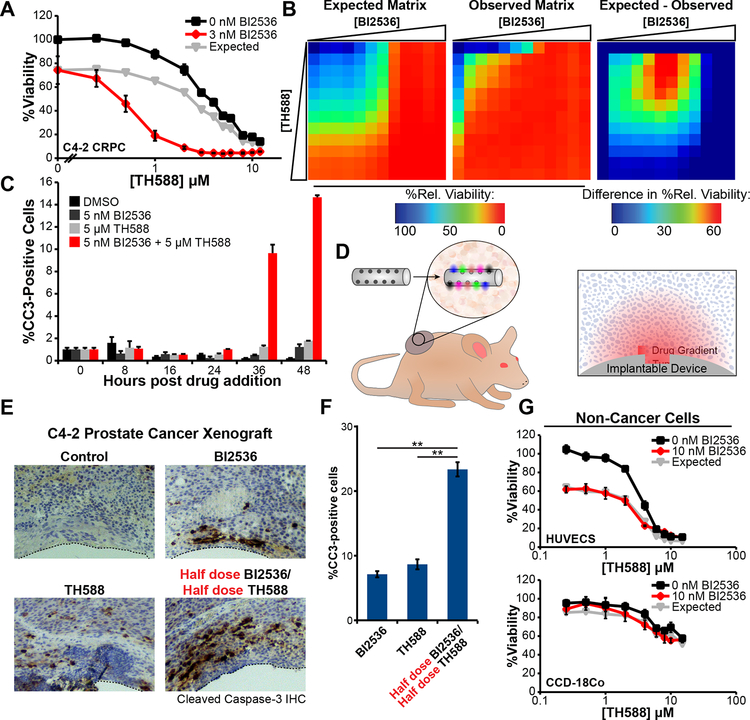
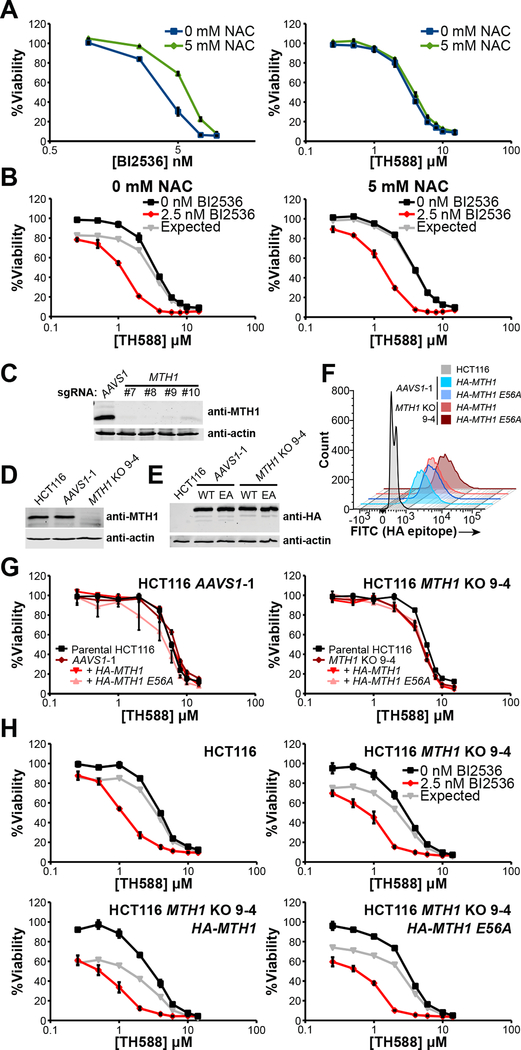
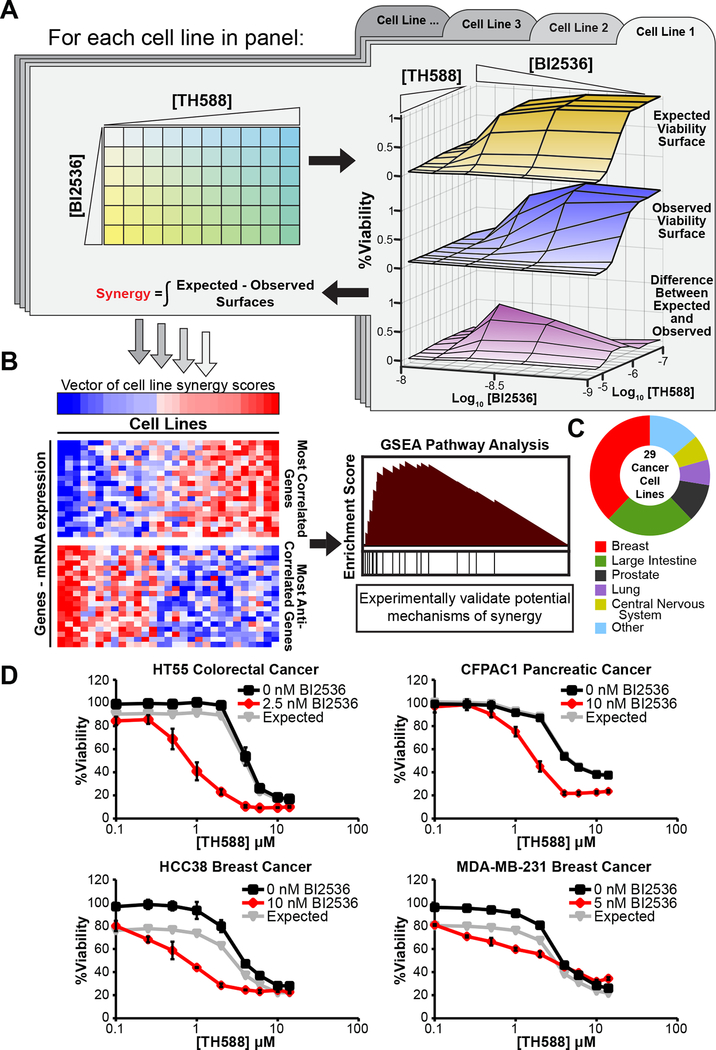
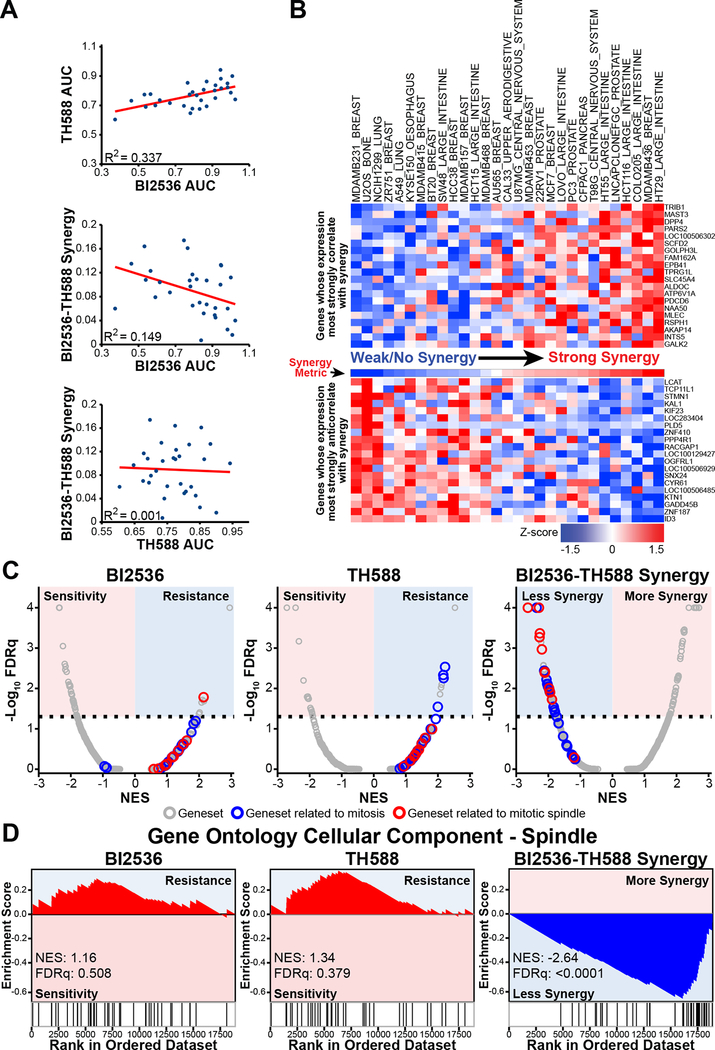
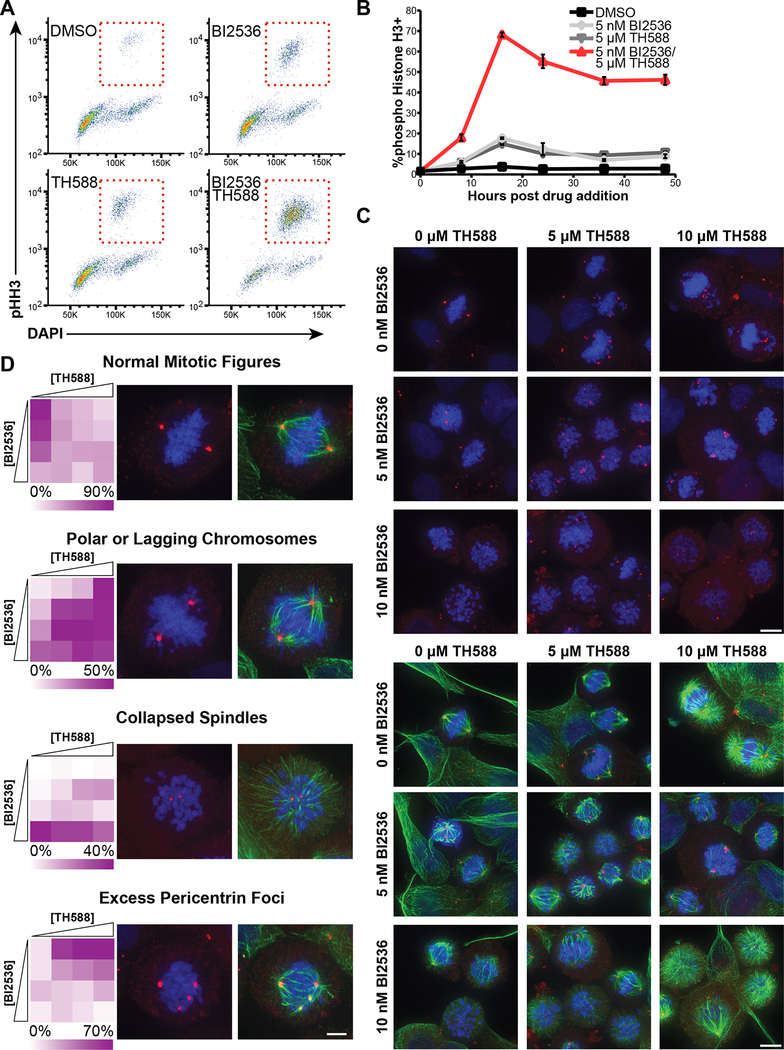
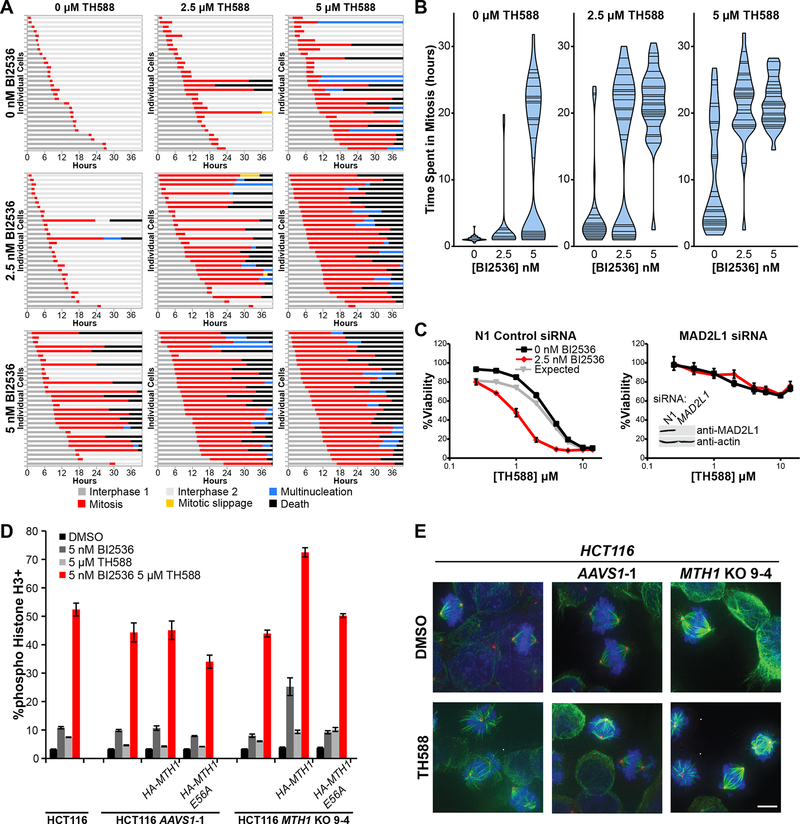
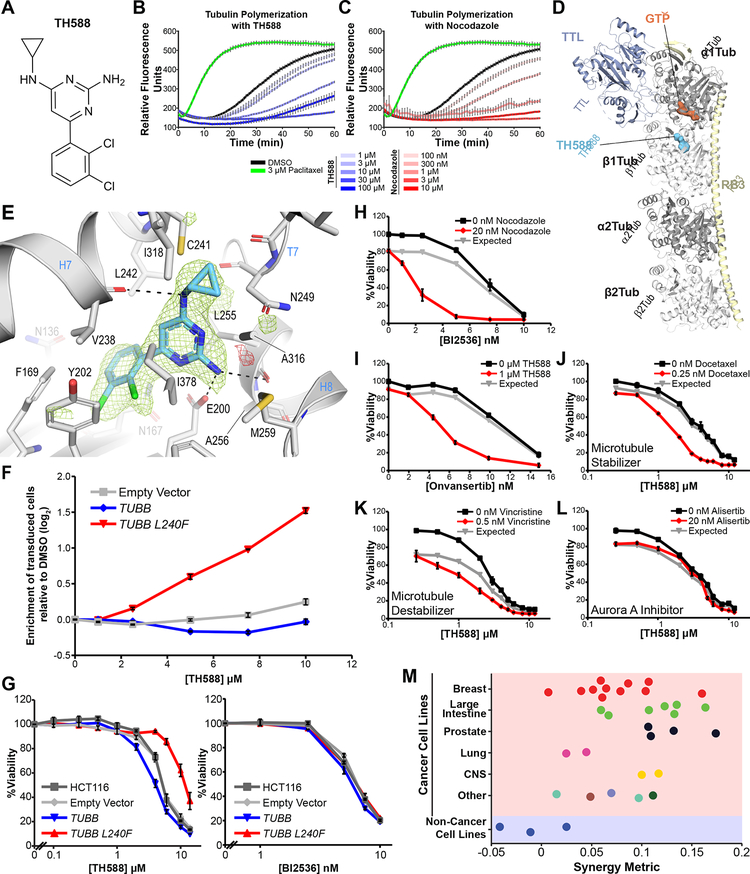
There is an unmet need for new antimitotic drug combinations that target cancer-specific vulnerabilities. Based on our finding of elevated biomolecule oxidation in mitotically arrested cancer cells, we combined Plk1 inhibitors with TH588, an MTH1 inhibitor that prevents detoxification of oxidized nucleotide triphosphates. This combination showed robust synergistic killing of cancer, but not normal, cells that, surprisingly, was MTH1-independent. To dissect the underlying synergistic mechanism, we developed VISAGE, a strategy integrating experimental synergy quantification with computational-pathway-based gene expression analysis. VISAGE predicted, and we experimentally confirmed, that this synergistic combination treatment targeted the mitotic spindle. Specifically, TH588 binding to β-tubulin impaired microtubule assembly, which when combined with Plk1 blockade, synergistically disrupted mitotic chromosome positioning to the spindle midzone. These findings identify a cancer-specific mitotic vulnerability that is targetable using Plk1 inhibitors with microtubule-destabilizing agents and highlight the general utility of the VISAGE approach to elucidate molecular mechanisms of drug synergy.

Keywords: MTH1; Plk1; TH588; anti-microtubule drugs; cancer therapy; chromosome alignment; chromosome congression; drug synergy; mitosis; tubulin.


Conflict of interest statement

DECLARATION OF INTERESTS

Michael B. Yaffe is a member of the Divisions of Surgical Oncology and Trauma and Critical Care, Department of Surgery, Beth Israel Deaconess Medical Center, Harvard Medical School, Boston, MA, and the Chief Academic Editor of the journal Science Signaling. The authors declare no competing interests.

Figures

Figure 1.
Figure 1.. The Plk1 inhibitor BI2536 and MTH1 inhibitor TH588 synergistically kill cancer cells in cell culture and in tumor xenografts.
(A) C4–2 CRPC cells were subjected to a dose-response matrix of the MTH1 inhibitor, TH588, and BI2536. Viability relative to vehicle control was measured 5 days after treatment. TH588 dose-response curves in the absence (black line) or presence (red line) of BI2536 are shown. Expected viability according to the Bliss independence model of drug additivity is shown in grey. Mean ± SEM for n = 3 experiments is shown. The dose of the Plk1 inhibitor shown was chosen based on a 10–20% decrease in relative viability when that drug was used as a single agent. (B) Heat map representation of the observed and expected BI2536-TH588 dose-response matrices and calculated difference between observed and expected viabilities after treatment of C4–2 cells for 5 days. Drug doses included all combinations of 1.25 fold serial dilutions starting from 14 nM and 12 μM for BI2536 and TH588, respectively, along with undrugged and single-drug controls. (C) C4–2 cells were treated with the indicated drugs, fixed at various times, and analyzed for the apoptotic marker cleaved-caspase-3 by flow cytometry. Mean ± SEM for n = 3 experiments is shown. (D) Illustration of the tumor implantable device for multiplexed drug sensitivity testing in vivo. Colored ovals (inset) indicate diffusion of distinct drug or drug combinations into the surrounding tissue. Right panel shows orientation of the device and drug gradients with respect to the fixed and stained tissue sections in panel (E). (E) C4–2 CRPC tumor xenografts on the hind flanks of castrated male NCR nude mice were implanted with devices. Fixed sections of the tissue adjacent to microwells containing the indicated drug were stained with antibodies directed against cleaved caspase-3 as a readout for apoptosis. Clear zones at the bottom of each micrograph (dotted lines) indicate where the device was located. (F) Percentage of cells positive for cleaved-caspase-3 within a 400 μm radius of the given well in the device was measured. Bars indicate the mean of measurements in three tumors ± SEM, ** p < 0.01 using a two-tailed Student’s t-test. (G) Non-cancer cell lines, HUVECs and CCD-18Co colon fibroblasts, were treated and analyzed as in panel (A). No synergy was observed. Mean ± SEM (n = 3) is shown.
Figure 2.
Figure 2.. MTH1 is dispensable for cancer cell viability, sensitivity to the MTH1 inhibitor TH588, and Plk1 inhibitor - TH588 synergy.
(A) C4–2 prostate cancer cells were treated with the indicated doses of BI2536 (left) or TH588 (right) in the presence (blue) or absence (green) of 5 mM NAC, added at the time of drug dosing. Relative viability was determined 5 days after drug addition. NAC decreased the sensitivity to the Plk1 inhibitor BI2536 but not to the MTH1 inhibitor TH588. Mean ± SEM (n = 3) is shown. (B) Synergy between TH588 and BI2536 was determined by culturing C4–2 cells with various doses of TH588 in the absence (black) or presence (red) of BI2536, with (right) or without (left) 5 mM NAC. Relative viability was measured at 5 days. Expected viability (gray lines) was calculated using the Bliss independence model of drug additivity. Mean ± SEM (n = 3) is shown. (C) Immunoblot analysis of lysates from polyclonal populations of HCT116 transductants co-expressing Cas9 and the indicated MTH1-targeting sgRNA. An sgRNA directed against AAVS1 served as a control. (D) Immunoblot analysis of MTH1 expression in HCT116 parental cells and single-cell clones derived from the populations shown in panel (C), denoted AAVS1-1 and MTH1 KO 9–4, respectively. (E, F) AAVS1-1 and MTH1 KO 9–4 single-cell clones were transduced with constructs containing HA-tagged wildtype (WT) MTH1 or a catalytically inactive mutant, MTH1 E56A (EA). Immunoblot analysis of HA-tagged MTH1 is shown in (E). Distribution of HA-tagged MTH1 expression measured by flow cytometry is shown in (F). (G) TH588 dose-response curves for the parental HCT116 cells and AAVS1-1 (left) or MTH1 KO 9–4 (right) clones without or with overexpression of HA-MTH1 or HA-MTH1 E56A. Cells were treated with TH588 for 5 days before measurement of relative viability. Mean ± SEM (n = 3) is shown. (H) The indicated cell lines from panels (D) and (E) were treated with increasing doses of TH588 in the presence (red lines) or absence (black lines) of 2.5 nM BI2536 for 5 days and assessed for relative viability. Gray lines depict expected viability according to the Bliss independence model of drug additivity. Synergy was observed regardless of either the total absence of MTH1 or its robust overexpression. Mean ± SEM (n = 3) is shown.
Figure 3.
Figure 3.. VISAGE – an approach for identifying mechanisms underlying synergistic drug combinations
(A) Overview of the experimental component. In an iterative process each cell line is subjected to a 60-point dose matrix consisting of all pairwise combinations of 6 doses of BI2536 and 10 doses of TH588. The response at each point of this dose matrix is used to generate observed (middle surface) and expected (top surface) dose-response surfaces according to the Bliss independence model of drug additivity. The integrated difference between the observed and expected surfaces (bottom surface) is quantified as a volumetric measurement of synergy. This measure of synergy is analogous to a single drug AUC in that it represents the total effect observed in a particular dose space and is also known as the Bliss independence volume. (B) Overview of the computational component. Cell lines are ranked according the quantity of synergy observed, and these data are used to calculate correlation coefficients between the synergy score vector and each gene’s mRNA expression profile across the CCLE cell lines included in the screen. Biologically coherent sets of genes whose basal expression are correlated with the presence or absence of synergy can be identified with GSEA, yielding insight and guiding validation of proposed synergistic mechanisms. (C) Tissue of origin composition of cell lines included in the BI2536/TH588 VISAGE cell line screen for BI2536/TH588 synergy. (D) Representative dose-response curves for TH588 (black) and TH588/BI2536 (red) co-treatment in cell lines that displayed a high (HT55), moderate (CFPAC1, HCC38), or very low (MDA-MB-231) degree of synergy. Relative viability was measured at 5 days. Expected viability (gray lines) was calculated using the Bliss independence model of drug additivity. Mean ± SEM (n = 3) is shown.
Figure 4.
Figure 4.. VISAGE predicts that the BI2536-TH588 drug combination synergistically targets mitosis and the mitotic spindle
(A) Scatter plots depicting correlation between individual drug sensitivities (AUC) and their correlation with synergy observed across cell lines in our screen. (B) Volumetric synergy scores were calculated as described in Figure 3A for each cell line (“Synergy Metric” between upper and lower heat maps). Cell lines were ranked according to synergy scores, increasing from left to right. Using CCLE data, genes were ranked based on the correlation between their expression and synergy across screened cell lines. Shown are the 20 genes whose expression profiles most strongly correlated (upper heat map) or anticorrelated (lower heat map) with the synergy scores. Rows were transformed to z-scores for ease of visualization. (C) The expression levels of individual genes ranked by correlation with sensitivity to individual drugs (AUC; left and middle panels) or synergy (right panel) were analyzed by weighted GSEA using the Hallmark, KEGG, Reactome, BioCarta and GO gene sets. Plotted is the FDRq (false discovery rate q-value, a multiple-hypothesis corrected metric of significance) value versus the normalized enrichment score (NES) for each of these gene sets. The dotted line represents an FDRq value cut-off of 0.05. Gene sets related to mitosis are depicted in blue, and gene sets related specifically to the mitotic spindle are depicted in red. Colored backgrounds indicate gene set enrichment associated with drug sensitivity or resistance, or synergy, as indicated. Gene sets associated with mitosis and the mitotic spindle are more significantly associated with synergy than with sensitivity to either drug alone. (D) The GO cellular component term ‘spindle’ was strongly enriched amongst genes with transcript levels that anticorrelated with the amount of synergy observed across various cell lines. This term was not significantly enriched amongst genes that correlated with resistance to the individual drugs alone.
Figure 5.
Figure 5.. Plk1 inhibition and TH588 synergistically arrest cells in mitosis, disrupt spindle formation and prevent metaphase chromosome alignment.
(A) C4–2 CRPC cells were treated for 16 hours with 5 nM BI2536, 5 μM TH588, or both in combination, and mitotic arrest measured by flow cytometry using DAPI and pHH3 antibody staining. Red boxes indicate the mitotic population. (B) Time course of pHH3+ cell accumulation caused by either BI2536 or TH588 alone, or their combination. C4–2 cells were fixed at the indicated time and stained as above. Mean ± SEM (n = 3). (C) C4–2 cells were treated with a dose-response matrix of BI2536 and TH588 for 16 hours and defects in the assembly of the mitotic spindle were assessed by deconvolution microscopy. Pericentrin (red) and tubulin (green) were detected by immunofluorescence; DNA was stained with DAPI (blue). Shown are representative projections of deconvoluted Z-stacks from a subset of the dose-response matrix. (A 2.5 nM BI2536 column and 2.5 μM TH588 row are omitted for brevity, shown in Figure S4A). White arrows indicate the appearance of multipolar spindles and polar chromosomes. Scale bars at bottom right of each matrix indicate 10 μm. Top and bottom panels show identical fields of cells, with DAPI and pericentrin staining shown in top panels and DAPI, pericentrin, and tubulin staining shown in bottom panels. (D) Mitotic spindle defects caused by each dose combination in the matrix described above were categorized based on phenotype. ‘Normal mitotic figures’ includes prophase, prometaphase, metaphase, anaphase and telophase cells. Mitotic cells with ‘polar or lagging chromosomes’ contained chromosomes that either overlapped the plane of a centrosome, or were positioned between the centrosome and the cell cortex. ‘Collapsed spindles’ were characterized by centrosomes surrounded by a cloud of chromosomes and tubulin polymers radiating from the center of the cell. The above three groups are mutually exclusive, but may co-occur with ‘excess pericentrin foci’. Between 61 and 134 mitotic cells were categorized per condition and their frequencies are depicted in heat maps (left). Representative micrographs for each of these categories are shown (right). Scale bar in the bottom right image represents 5 μm.
Figure 6.
Figure 6.. Cell death from TH588/BI2536 co-treatment occurs by prolonged mitotic arrest, requires the SAC, and is MTH1-independent.
(A) Quantification of phenotypic outcomes of C4–2 CRPC cells expressing mEmerald-tubulin and H2B-mCherry treated with a dose-response matrix of BI2536 and TH588, and imaged at 15 min intervals. Each bar represents a single cell, with color indicating its phenotype/cell cycle state over the time course of the experiment. Thirty cells that initiated and exited mitosis during the time-lapse were analyzed per condition. (B) Violin plots depicting the distribution in duration of mitosis of C4–2 cells from panel (A) above. Position of horizontal lines on the y-axis indicates duration of mitosis of individual cells. (C) Disruption of the SAC by MAD2L1 knockdown ablates sensitivity to TH588 and entirely prevents synergy with BI2536. Cells were treated with the indicated drugs 48 hours after control or MAD2L1 siRNA transfection and assessed for viability at 5 days. Bottom left inset on the right graph shows immunoblots of lysates from cells 48 hours after transfection of the indicated siRNA, confirming loss of MAD2. Mean ± SEM (n = 3) is shown. (D) HCT116 cells, or single-cell clones expressing a control guide RNA (AAVS1-1), the MTH1 KO 9–4, clone, and the same clone transduced with constructs containing HA-MTH1 or HAMTH1 E56A were treated with the indicated drugs for 16 hours, fixed, stained with DAPI and antibodies against pHH3, and analyzed by flow cytometry to assess the percentage of mitotically arrested cells. Mean ± SEM (n = 3) is shown. (E) Parental HCT116 cells, as well as the AAVS1-1 and MTH1 KO 9–4 clones were treated with 5 μM TH588 for 16 hours, fixed and stained for DNA (DAPI; blue), pericentrin (red) and tubulin (green). Representative deconvolved Z-stack projections are shown. Scale bar at bottom right indicates 10 μm. White arrowheads indicate cells undergoing abnormal mitosis.
Figure 7.
Figure 7.. TH588 induces cell death by binding to the colchicine binding site in tubulin, inhibiting microtubule polymerization, and specifically synergizing with Plk1 inhibtors in cancer cells
(A) Chemical structure of TH588. (B, C) Microtubules were assembled from purified porcine a/b tubulin by incubation at 37°C in the presence of 1 mM GTP and varying doses of TH588 (B) or nocodazole (C), and tubulin polymerization measured by time-dependent fluorescence-enhancement of the microtubule indicator dye, 4’,6-Diamidino-2-phenylindole (Bonne et al., 1985). Paclitaxel was used a positive control for microtubule stabilization. Shown are time course experiments, where the relative fluorescent signal indicates the quantity of polymerized tubulin. Mean ± SEM (n = 3). (D) Overall view of the T2R-TTL-TH588 complex structure at 2.3Å resolution. The a-tubulin and β-tubulin chains are in dark and light grey, TTL is in powder blue and RB3 is in pale yellow ribbon representation, respectively. The tubulin-bound TH588 in the colchicine binding site and the GTP molecule in the N-terminal binding domain of α-tubulin are shown in surface representation. The carbon atoms are colored in light blue (TH588) and dark orange (ATP), respectively. (E) Close-up view of the atomic interaction network observed between TH588 (light blue) and tubulin (gray). Interacting residues of tubulin are shown in stick representation and are labeled. Oxygen and nitrogen atoms are colored red and blue, respectively; carbon atoms are in light blue (TH588) or gray (tubulin). Hydrogen bonds are depicted as black dashed lines. Secondary structural elements of tubulin are labeled in blue. The simulated annealing mFo-DFc omit map highlighting the shape of TH588 is contoured at +3.0 σ (green mesh) and −3.0 σ (red mesh), respectively. (F) HCT116 colorectal cancer cells were transduced with empty vector pHR-SFFV-IRES-mCherry or the same vector containing either wildtype TUBB or the mutant TUBB L240F. These cells were then mixed one to one with untransduced HCT116 cells and subjected to increasing concentrations of TH588. After 72 hours the relative proportion of mCherry positive and negative cells was determined by flow cytometry. Enrichment was defined as the ratio of mCherry+/mCherry− for each sample normalized to the geometric mean of DMSO control samples and log2 transformed. Mean ± SEM (n = 3) is shown. (G) HCT116 colorectal transduced as in panel (F) were subjected to increasing concentrations of the TH588 (left) or BI2536 (right) and assessed for viability after 5 days. Mean ± SEM (n = 3). (H) C4–2 CRPC cells were treated with increasing doses of BI2536 in the presence (red lines) or absence (black lines) of the known microtubule polymerization inhibitor, nocodazole (top), or TH588 (bottom). Relative viability was measured at 5 days. The Bliss independence model of drug additivity was used to calculate expected relative viability (gray lines) and identify drug synergy. Mean ± SEM (n = 3) is shown. (I) Onvansertib, a structurally distinct and highly specific Plk1 inhibitor, was combined with TH588 to assess synergy in C4–2 CRPC cells. Data was acquired, analyzed and plotted as in H. (J-L) C4–2 CRPC cells were subjected to a dose-response matrix of the MTH1 inhibitor, TH588, and one of several antimitotic drugs (docetaxel (J), vincristine (K), or alisertib (L)) for 5 days. Shown are representative TH588 dose-response curves in the absence (black line) or presence (red line) of the indicated antimitotic drug. Gray line is expected viability according to the Bliss independence model of drug additivity. Mean ± SEM (n = 3) is shown. The dose of the antimitotic shown was chosen based on a 10–20% decrease in relative viability when that drug was used as a single agent. (M) Swarm plot showing the degree of synergy observed in individual cell lines separated by tissue of origin and transformation status. On the top (red area), are cancer cell lines from the indicated tissues of origin, on the bottom are non-cancer cell lines (blue area).

Similar articles

Cited by

References

    1. Adams PD, Afonine PV, Bunkoczi G, Chen VB, Davis IW, Echols N, Headd JJ, Hung LW, Kapral GJ, Grosse-Kunstleve RW, et al. (2010). PHENIX: a comprehensive Python-based system for macromolecular structure solution. Acta crystallographica Section D, Biological crystallography 66, 213–221. - PMC - PubMed
    1. Alexander J, Lim D, Joughin BA, Hegemann B, Hutchins JR, Ehrenberger T, Ivins F, Sessa F, Hudecz O, Nigg EA, et al. (2011). Spatial exclusivity combined with positive and negative selection of phosphorylation motifs is the basis for context-dependent mitotic signaling. Sci Signal 4, ra42. - PMC - PubMed
    1. Alexandre J, Batteux F, Nicco C, Chereau C, Laurent A, Guillevin L, Weill B, and Goldwasser F (2006). Accumulation of hydrogen peroxide is an early and crucial step for paclitaxel-induced cancer cell death both in vitro and in vivo. Int J Cancer 119, 41–48. - PubMed
    1. Archambault V, and Glover DM (2009). Polo-like kinases: conservation and divergence in their functions and regulation. Nat Rev Mol Cell Biol 10, 265–275. - PubMed
    1. Ba X, and Boldogh I (2018). 8-Oxoguanine DNA glycosylase 1: Beyond repair of the oxidatively modified base lesions. Redox Biol 14, 669–678. - PMC - PubMed

Publication types

MeSH terms