

Enhancing Schwann cell migration using concentration gradients of laminin-derived peptides
- PMID: 31302351
- PMCID: PMC6868524
- DOI: 10.1016/j.biomaterials.2019.119335
Enhancing Schwann cell migration using concentration gradients of laminin-derived peptides
Abstract
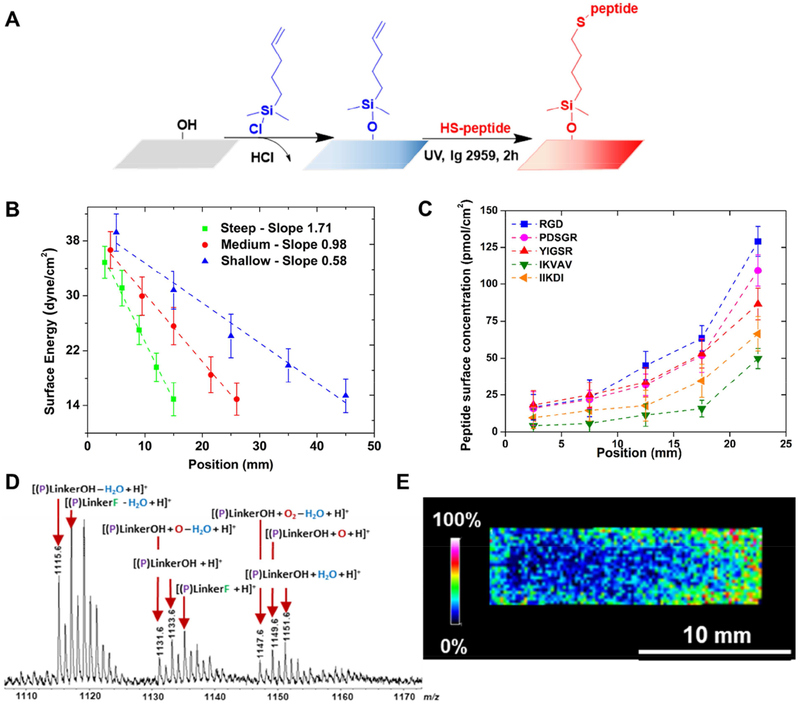
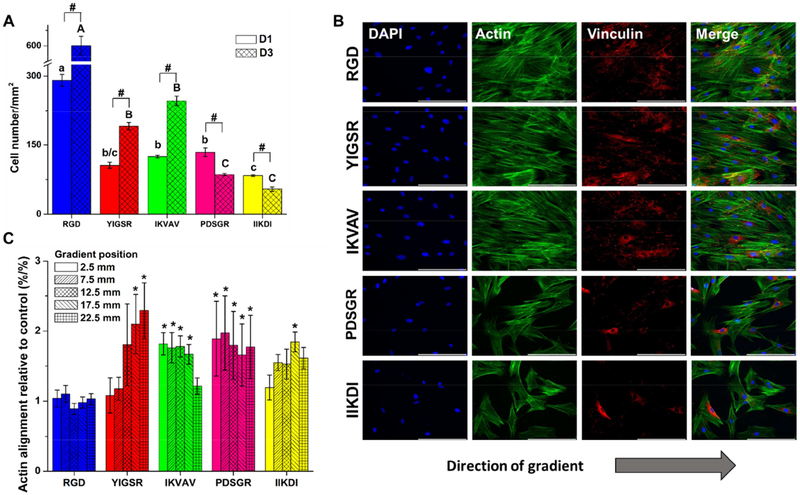
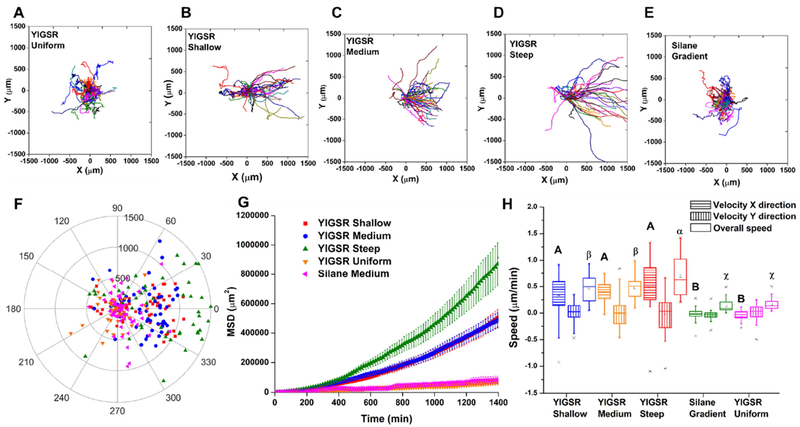
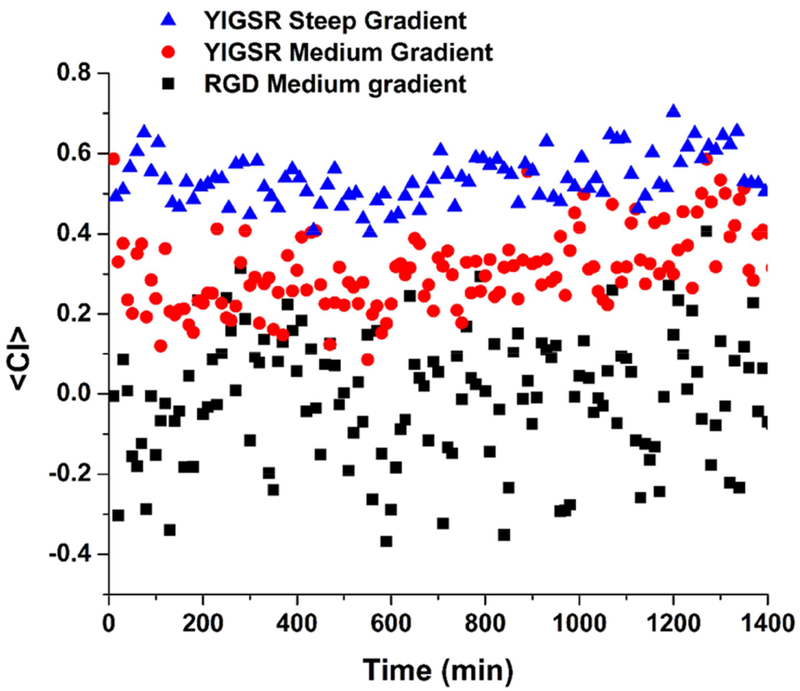
Neuroregeneration following peripheral nerve injury is largely mediated by Schwann cells (SC), the principal glial cell that supports neurons in the peripheral nervous system. Axonal regeneration in vivo is limited by the extent of SC migration into the gap between the proximal and distal nerve, however, little is known regarding the principal driving forces for SC migration. Engineered microenvironments, such as molecular and protein gradients, play a role in the migration of many cell types, including cancer cells and fibroblasts. However, haptotactic strategies have not been applied widely to SC. Herein, a series of tethered laminin-derived peptides were analyzed for their influence on SC adhesion, proliferation, and alignment. Concentration gradient substrates were fabricated using a controlled vapor deposition method, followed by covalent peptide attachment via a thiol-ene reaction, and characterized by X-ray photoelectron spectroscopy (XPS) and MALDI-MS imaging. While tethered RGD peptides supported SC adhesion and proliferation, concentration gradients of RGD had little influence on biased SC directional migration. In contrast, YIGSR promoted less SC attachment than RGD, yet YIGSR peptide gradients directed migration with a strong bias to the concentration profile. With YIGSR peptide, overall speed increased with the steepness of the peptide concentration profile. YIGSR gradients had no haptotactic effect on rat dermal fibroblast migration, in contrast to fibroblast migration on RGD gradients. The response of SC to these tethered peptide gradients will guide the development of translationally relevant constructs designed to facilitate endogenous SC infiltration into defects for nerve regeneration.
Keywords: Cell migration; Concentration gradient; Haptotaxis; Laminin-derived peptides; Schwann cells.
Copyright © 2019 Elsevier Ltd. All rights reserved.
Figures


Similar articles
-
Micropatterned biodegradable polyesters clicked with CQAASIKVAV promote cell alignment, directional migration, and neurite outgrowth.Acta Biomater. 2018 Jul 1;74:143-155. doi: 10.1016/j.actbio.2018.05.018. Epub 2018 May 13. Acta Biomater. 2018. PMID: 29768188
-
A laminin-2-derived peptide promotes early-stage peripheral nerve regeneration in a dual-component artificial nerve graft.J Tissue Eng Regen Med. 2013 Oct;7(10):788-800. doi: 10.1002/term.1468. Epub 2012 Mar 21. J Tissue Eng Regen Med. 2013. PMID: 22438104
-
A complementary density gradient of zwitterionic polymer brushes and NCAM peptides for selectively controlling directional migration of Schwann cells.Biomaterials. 2015 Jul;56:58-67. doi: 10.1016/j.biomaterials.2015.03.052. Epub 2015 Apr 15. Biomaterials. 2015. PMID: 25934279
-
Substrate-bound protein gradients to study haptotaxis.Front Bioeng Biotechnol. 2015 Mar 30;3:40. doi: 10.3389/fbioe.2015.00040. eCollection 2015. Front Bioeng Biotechnol. 2015. PMID: 25870855 Free PMC article. Review.
-
Peptide modulators of cell migration: Overview, applications and future development.Drug Discov Today. 2023 May;28(5):103554. doi: 10.1016/j.drudis.2023.103554. Epub 2023 Mar 13. Drug Discov Today. 2023. PMID: 36921670 Free PMC article. Review.
Cited by
-
Epothilone B Facilitates Peripheral Nerve Regeneration by Promoting Autophagy and Migration in Schwann Cells.Front Cell Neurosci. 2020 May 26;14:143. doi: 10.3389/fncel.2020.00143. eCollection 2020. Front Cell Neurosci. 2020. PMID: 32528253 Free PMC article.
-
Laminin-1 Peptides Conjugated to Fibrin Hydrogels Promote Salivary Gland Regeneration in Irradiated Mouse Submandibular Glands.Front Bioeng Biotechnol. 2021 Sep 24;9:729180. doi: 10.3389/fbioe.2021.729180. eCollection 2021. Front Bioeng Biotechnol. 2021. PMID: 34631679 Free PMC article.
-
Evaluating Biocompatibility: From Classical Techniques to State-of-the-Art Functional Proteomics.Nanomaterials (Basel). 2025 Jul 3;15(13):1032. doi: 10.3390/nano15131032. Nanomaterials (Basel). 2025. PMID: 40648740 Free PMC article. Review.
-
3D printed elastic hydrogel conduits with 7,8-dihydroxyflavone release for peripheral nerve repair.Mater Today Bio. 2023 Apr 30;20:100652. doi: 10.1016/j.mtbio.2023.100652. eCollection 2023 Jun. Mater Today Bio. 2023. PMID: 37214548 Free PMC article.
-
Bioactivity effects of extracellular matrix proteins on apical papilla cells.J Appl Oral Sci. 2021 Sep 3;29:e20210038. doi: 10.1590/1678-7757-2021-0038. eCollection 2021. J Appl Oral Sci. 2021. PMID: 34495108 Free PMC article.
References
-
- Faweett J, Keynes RJ, Peripheral nerve regeneration. Annu Rev Neurosci 13(1):43–60 (1990). - PubMed
-
- López-Cebral R, Silva-Correia J, Reis RL, Silva TH, Oliveira JM, Peripheral Nerve Injury: Current Challenges, Conventional Treatment Approaches, and New Trends in Biomaterials-Based Regenerative Strategies. ACS Biomater Sci Eng 3(12):3098–3122 (2017). - PubMed
-
- Langer R, Vacanti J, Tissue engineering. Science 260(5110):920–926 (1993). - PubMed
-
- Shin H, Jo S, Mikos AG, Biomimetic materials for tissue engineering. Biomaterials 24(24):4353–4364 (2003). - PubMed
-
- Scheib J, Höke A, Advances in peripheral nerve regeneration. Nat Rev Neurol 9:668 (2013). - PubMed
Publication types
MeSH terms
Substances
Grants and funding
LinkOut - more resources
Full Text Sources
Miscellaneous
