

Identifying Cancer Driver lncRNAs Bridged by Functional Effectors through Integrating Multi-omics Data in Human Cancers
- PMID: 31302496
- PMCID: PMC6626872
- DOI: 10.1016/j.omtn.2019.05.030
Identifying Cancer Driver lncRNAs Bridged by Functional Effectors through Integrating Multi-omics Data in Human Cancers
Abstract
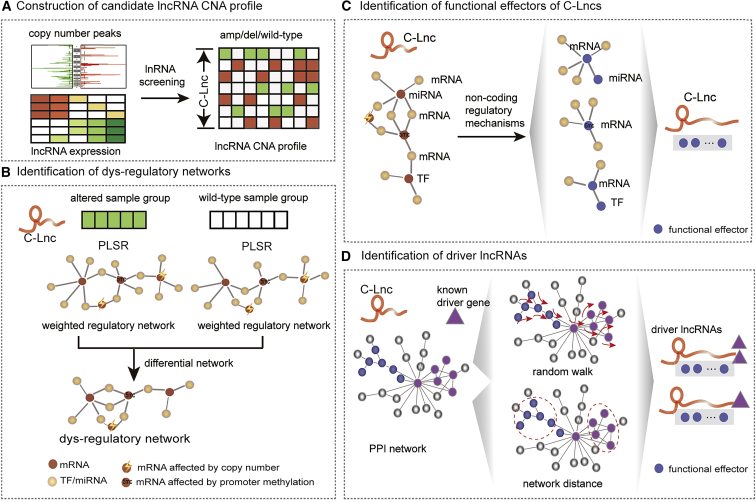
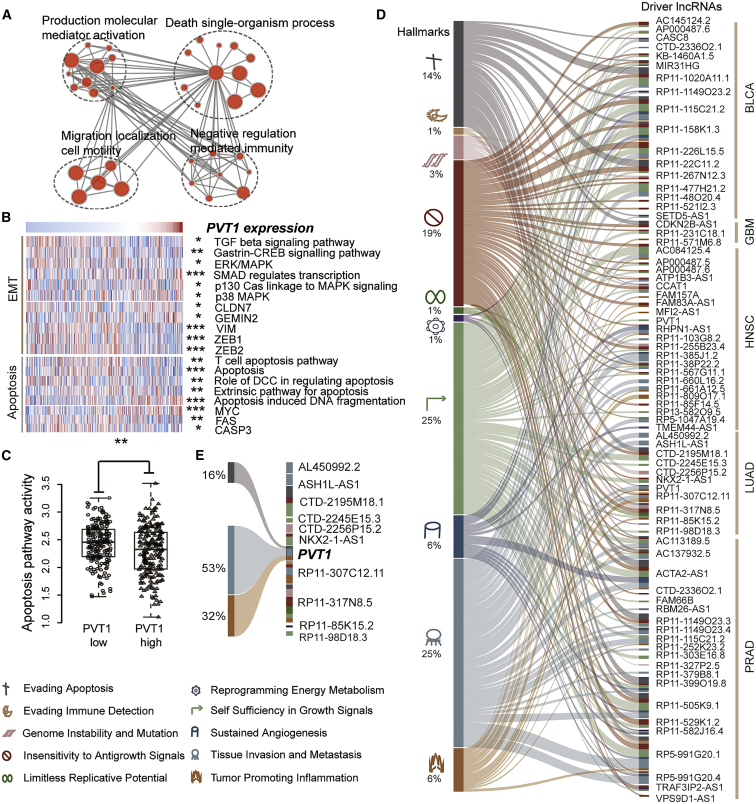
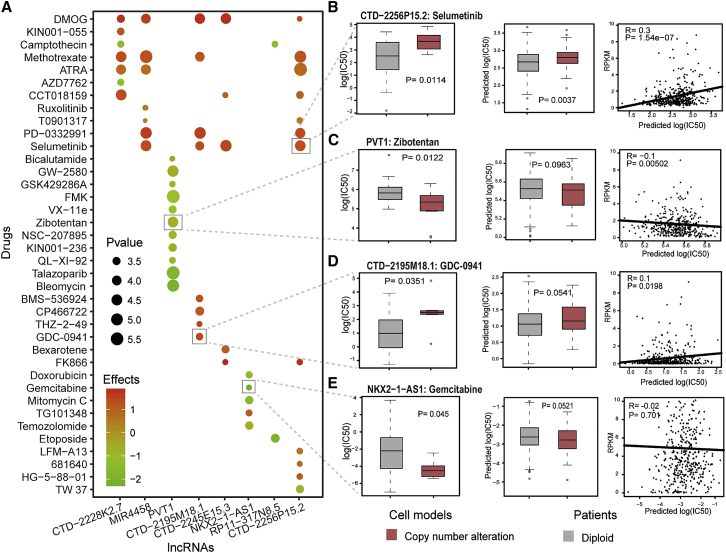
The accumulation of somatic driver mutations in the human genome enables cells to gradually acquire a growth advantage and contributes to tumor development. Great efforts on protein-coding cancer drivers have yielded fruitful discoveries and clinical applications. However, investigations on cancer drivers in non-coding regions, especially long non-coding RNAs (lncRNAs), are extremely scarce due to the limitation of functional understanding. Thus, to identify driver lncRNAs integrating multi-omics data in human cancers, we proposed a computational framework, DriverLncNet, which dissected the functional impact of somatic copy number alteration (CNA) of lncRNAs on regulatory networks and captured key functional effectors in dys-regulatory networks. Applying it to 5 cancer types from The Cancer Genome Atlas (TCGA), we portrayed the landscape of 117 driver lncRNAs and revealed their associated cancer hallmarks through their functional effectors. Moreover, lncRNA RP11-571M6.8 was detected to be highly associated with immunotherapeutic targets (PD-1, PD-L1, and CTLA-4) and regulatory T cell infiltration level and their markers (IL2RA and FCGR2B) in glioblastoma multiforme, highlighting its immunosuppressive function. Meanwhile, a high expression of RP11-1020A11.1 in bladder carcinoma was predictive of poor survival independent of clinical characteristics, and CTD-2256P15.2 in lung adenocarcinoma responded to the sensitivity of methyl ethyl ketone (MEK) inhibitors. In summary, this study provided a framework to decipher the mechanisms of tumorigenesis from driver lncRNA level, established a new landscape of driver lncRNAs in human cancers, and offered potential clinical implications for precision oncology.
Keywords: cancer drivers; cancer hallmarks; copy number alterations; immunosuppression; long non-coding RNAs.
Copyright © 2019 The Author(s). Published by Elsevier Inc. All rights reserved.
Figures


Similar articles
-
A pan-cancer atlas of cancer hallmark-associated candidate driver lncRNAs.Mol Oncol. 2018 Nov;12(11):1980-2005. doi: 10.1002/1878-0261.12381. Epub 2018 Oct 2. Mol Oncol. 2018. PMID: 30216655 Free PMC article.
-
Systematic identification of long non-coding RNAs with cancer-testis expression patterns in 14 cancer types.Oncotarget. 2017 Oct 19;8(55):94769-94779. doi: 10.18632/oncotarget.21930. eCollection 2017 Nov 7. Oncotarget. 2017. PMID: 29212265 Free PMC article.
-
LncmiRSRN: identification and analysis of long non-coding RNA related miRNA sponge regulatory network in human cancer.Bioinformatics. 2018 Dec 15;34(24):4232-4240. doi: 10.1093/bioinformatics/bty525. Bioinformatics. 2018. PMID: 29955818
-
Targeting long non-coding RNAs in cancers: progress and prospects.Int J Biochem Cell Biol. 2013 Aug;45(8):1895-910. doi: 10.1016/j.biocel.2013.05.030. Epub 2013 Jun 4. Int J Biochem Cell Biol. 2013. PMID: 23748105 Review.
-
Drug-induced modifications and modulations of microRNAs and long non-coding RNAs for future therapy against Glioblastoma Multiforme.Gene. 2020 Jan 10;723:144126. doi: 10.1016/j.gene.2019.144126. Epub 2019 Oct 4. Gene. 2020. PMID: 31589963 Review.
Cited by
-
Long non-coding RNAs and MYC association in hematological malignancies.Ann Hematol. 2020 Oct;99(10):2231-2242. doi: 10.1007/s00277-020-04166-4. Epub 2020 Jul 4. Ann Hematol. 2020. PMID: 32621182 Review.
-
Identification and Characterization of the Copy Number Dosage-Sensitive Genes in Colorectal Cancer.Mol Ther Methods Clin Dev. 2020 Jun 24;18:501-510. doi: 10.1016/j.omtm.2020.06.020. eCollection 2020 Sep 11. Mol Ther Methods Clin Dev. 2020. PMID: 32775488 Free PMC article.
-
Long Non-coding RNAs: Emerging Roles in the Immunosuppressive Tumor Microenvironment.Front Oncol. 2020 Jan 31;10:48. doi: 10.3389/fonc.2020.00048. eCollection 2020. Front Oncol. 2020. PMID: 32083005 Free PMC article. Review.
-
LBX2-AS1 Activates FSTL3 by Binding to Transcription Factor RARα to Foster Proliferation, Migration, and Invasion of Thyroid Cancer.Front Genet. 2021 Nov 11;12:765033. doi: 10.3389/fgene.2021.765033. eCollection 2021. Front Genet. 2021. PMID: 34858481 Free PMC article.
-
LINC00467, Driven by Copy Number Amplification and DNA Demethylation, Is Associated with Oxidative Lipid Metabolism and Immune Infiltration in Breast Cancer.Oxid Med Cell Longev. 2021 Dec 15;2021:4586319. doi: 10.1155/2021/4586319. eCollection 2021. Oxid Med Cell Longev. 2021. PMID: 34956437 Free PMC article.
References
-
- Alexandrov L.B. Understanding the origins of human cancer. Science. 2015;350:1175. - PubMed
-
- Cheng F., Hong H., Yang S., Wei Y. Individualized network-based drug repositioning infrastructure for precision oncology in the panomics era. Brief. Bioinform. 2017;18:682–697. - PubMed
-
- Adelman K., Egan E. Non-coding RNA: More uses for genomic junk. Nature. 2017;543:183–185. - PubMed
LinkOut - more resources
Full Text Sources
Other Literature Sources
Research Materials
Miscellaneous
