. 2019 Dec 1;31(16):1213-1234.
doi: 10.1089/ars.2018.7718. Epub 2019 Aug 21.

Mutations in RHOT1 Disrupt Endoplasmic Reticulum-Mitochondria Contact Sites Interfering with Calcium Homeostasis and Mitochondrial Dynamics in Parkinson's Disease

Affiliations

Mutations in RHOT1 Disrupt Endoplasmic Reticulum-Mitochondria Contact Sites Interfering with Calcium Homeostasis and Mitochondrial Dynamics in Parkinson's Disease

Dajana Grossmann et al. Antioxid Redox Signal. .

Abstract

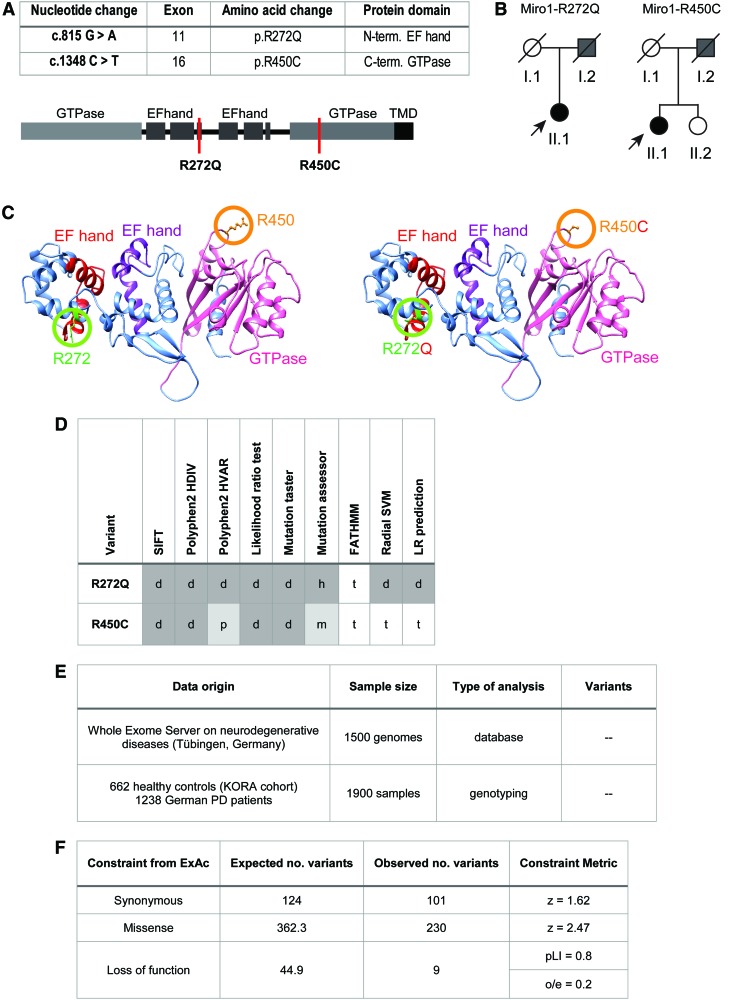
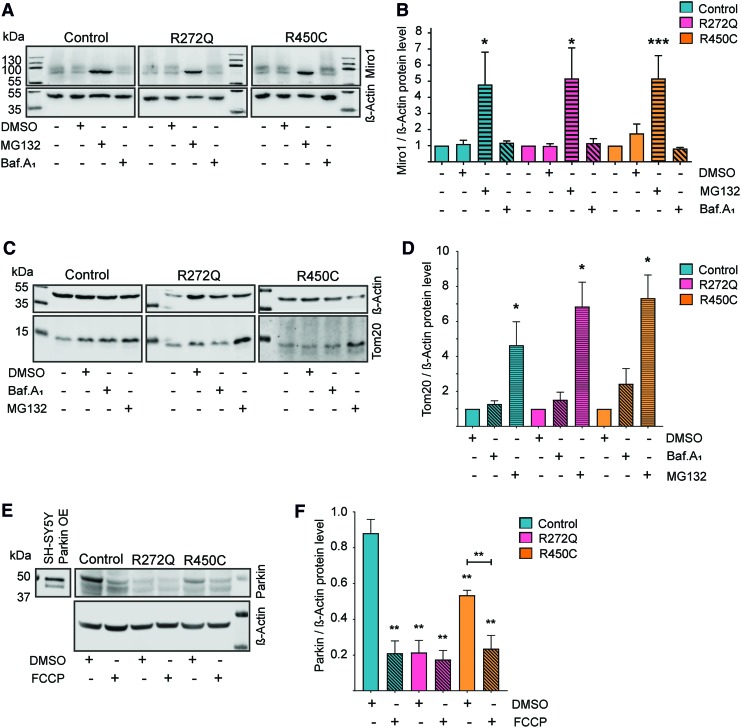
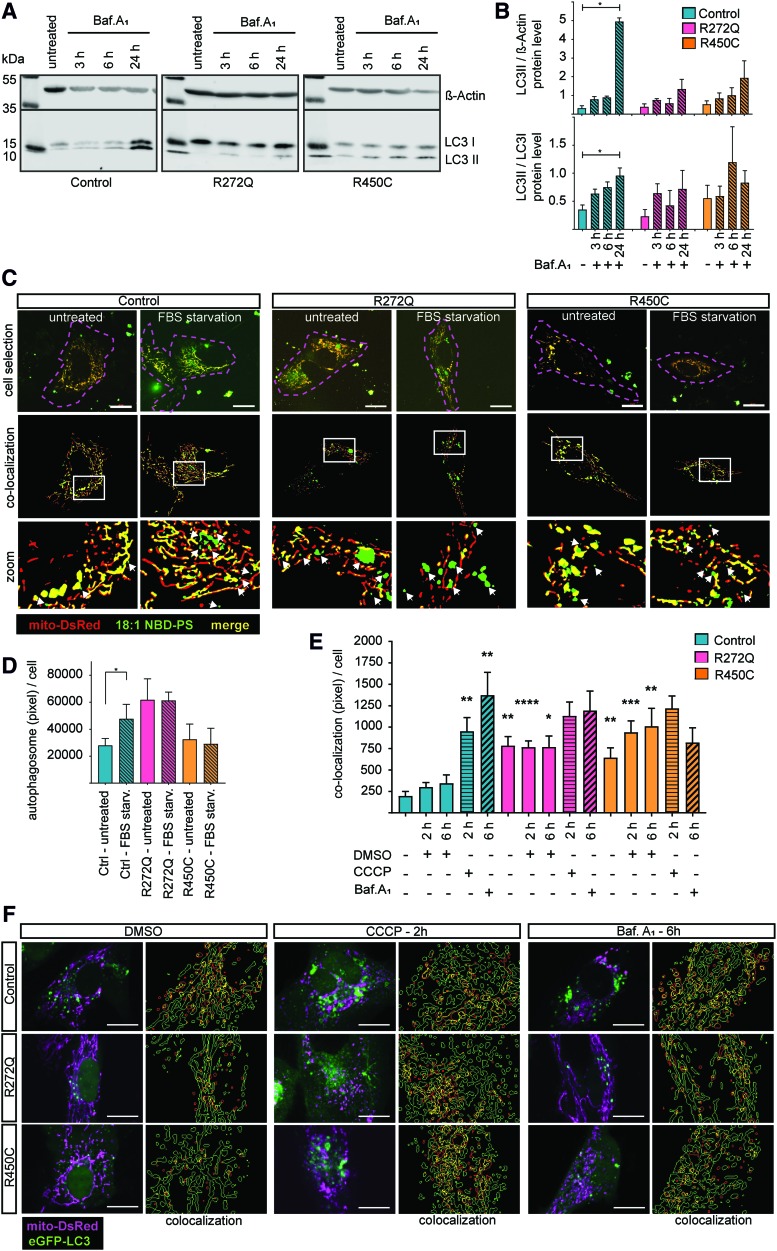
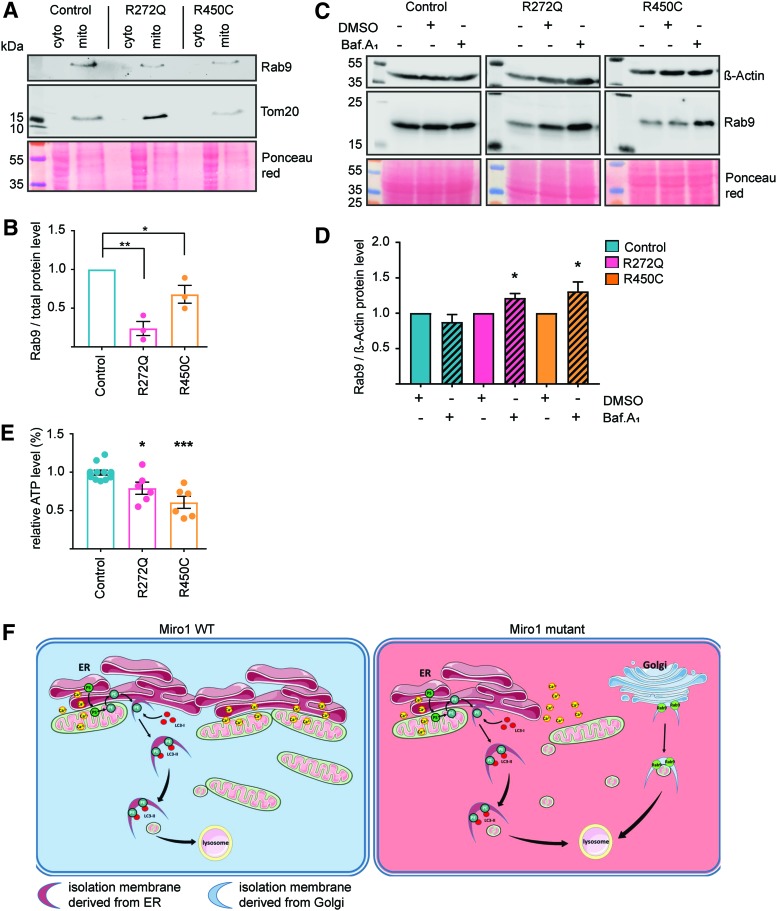
Aims: The outer mitochondrial membrane protein Miro1 is a crucial player in mitochondrial dynamics and calcium homeostasis. Recent evidence indicated that Miro1 mediates calcium-induced mitochondrial shape transition, which is a prerequisite for the initiation of mitophagy. Moreover, altered Miro1 protein levels have emerged as a shared feature of monogenic and sporadic Parkinson's disease (PD), but, so far, no disease-associated variants in RHOT1 have been identified. Here, we aim to explore the genetic and functional contribution of RHOT1 mutations to PD in patient-derived cellular models. Results: For the first time, we describe heterozygous RHOT1 mutations in two PD patients (het c.815G>A; het c.1348C>T) and identified mitochondrial phenotypes with reduced mitochondrial mass in patient fibroblasts. Both mutations led to decreased endoplasmic reticulum-mitochondrial contact sites and calcium dyshomeostasis. As a consequence, energy metabolism was impaired, which in turn caused increased mitophagy. Innovation and Conclusion: Our study provides functional evidence that ROTH1 is a genetic risk factor for PD, further implicating Miro1 in calcium homeostasis and mitochondrial quality control.

Keywords: ER–mitochondria contact site; Miro1; Parkinson's disease; calcium; mitochondria; patient fibroblasts.


Conflict of interest statement

R.K. received honoraria/travel grants from Abbvie, Zambon, and Medtronic and participated as site Principal Investigator for industry-sponsored clinical trials without receiving additional honoraria. All other authors have no competing financial interests.

Figures

<b>FIG. 1.</b>
FIG. 1.
Identification of R272Q and R450C RHOT1 variants in PD patients. (A) Table of point mutations identified in RHOT1 in two PD patients and location of both mutations within the protein structure of Miro1. Miro1 consists of an N-terminal GTPase domain, followed by two EF-hand domains, a C-terminal GTPase domain, and a TMD. (B) Pedigree of PD patients with heterozygous point mutations in RHOT1. Individuals displaying motor symptoms are highlighted in gray, arrows pointing to PD patients of whom fibroblasts were obtained for the present study. (C) Left panel: homology model of WT human Miro1, covering the 3D protein structure of the both EF-hand domains and the C-terminal GTPase domain. The WT amino acids R272 and R450 are highlighted in circles. Right panel: homology model of mutant Miro1 with both mutant amino acids R272Q and R450C highlighted in circles. (D) In silico prediction of pathogenic effects of both Miro1 variants. d/h, deleterious/highly functional; p/m, probably damaging/medium functional; t, tolerant. (E) Genotyping and data mining of a set of PD and control databases to identify additional carriers of the RHOT1 mutations. The whole-exome server on neurodegenerative disease, containing 1500 genomes, was searched for additional carriers of the R272Q and R450C variants. Additionally, 1900 samples (662 control individuals from the KORA cohort and 1238 German PD patients) (51) were genotyped to confirm our previous findings. No additional carrier of the R272Q or R450C variants was identified. (F) Burden analysis of variants in RHOT1 from the gnomAD database. LoF variants were defined as single nucleotide exchanges causing nonsense splice acceptor or splice donor variants. Z-score = calculated from expected variant counts divided by observed variant counts. pLI scores close to 1 indicate a high intolerance to LoF variants. 3D, three-dimensional; LoF, loss-of-function; PD, Parkinson's disease; pLI, probability of being LoF intolerant; TMD, transmembrane domain; WT, wild type. Color images are available online.
<b>FIG. 2.</b>
FIG. 2.
Reduced calcium buffering capacity in Miro1-mutant fibroblasts. (A) Overview of treatments with thapsigargin, ionomycin, and Ru360 for calcium imaging. Thapsigargin inhibits calcium uptake of the ER by the SERCA pumps, which leads to increase of cytosolic calcium levels by depletion of ER calcium stores. Ionomycin increases the levels of cytosolic calcium by activation of G-protein-coupled receptors in the plasma membrane. Ru360 is an inhibitor of the MCU. (B) Immortalized fibroblasts were loaded with Fluo4-AM (green) for live cell imaging. Cells were imaged under baseline condition for 2 min. After addition of 1 μM thapsigargin, imaging was continued for 10 min with a 2 s interval. Images were acquired using a 25 × objective; scale bars indicate 50 μm. (C) Quantification of calcium levels upon thapsigargin treatment from (B). Mean intensity of Fluo4-AM signal was indicated as (F/F0). Data indicated as mean ± SEM, n = 5, with 8–20 cells per cell line per experiment. (D) Time constant of exponential decay calculated from calcium response curves of (C). Data indicated as mean ± SEM. Significance calculated using the Mann–Whitney test (n = 5). (E) Immortalized fibroblasts were stained with Fluo4-AM for live cell imaging. After 1 min of baseline recording, cells were treated with a combination of 10 μM Ru360 and 1 μM thapsigargin, and imaging was continued for 9 min, using a 25 × objective (n = 3–4). Data indicated as mean. (F) Slope of linear regression of calcium response curves from (E). Data indicated as mean ± SEM. Significance calculated using the Mann–Whitney test (n = 3–4). (G) Immortalized fibroblasts were stained with Fluo4-AM and treated with 10 μM Ru360 during live cell imaging. Data indicated as mean (n = 3). (H) Microscopy images from (I) were analyzed for aspect ratios of the mitochondrial network over time using the ImageJ (n = 3–5). (I) Immortalized fibroblasts were stained with MitoTracker® Green FM and treated with 20 μM ionomycin during 20 min of live cell imaging, using a 63 × objective. Scale bars indicate 20 μm. Representative images of the mitochondrial network in control fibroblasts, Miro1-R272Q, and R450C fibroblasts. Mitochondrial masks generated with the ImageJ for the analysis of mitochondrial morphology were displayed at different time points for all cell lines. The white boxes in the microscopy images on the left highlight the sections depicted on the right, showing details of the mitochondrial network at different time points (binary images). Significance for all data calculated by the Mann–Whitney test. *p ≤ 0.05. ER, endoplasmic reticulum; MCU, mitochondrial calcium uniporter; SEM, standard error of the mean. Color images are available online.
<b>FIG. 3.</b>
FIG. 3.
Decreased ERmitochondrial contact sites in Miro1-mutant fibroblasts. (A) Native fibroblasts were stained with MitoTracker Deep Red (magenta) and ER-Tracker Green. Images were obtained with a 40 × objective (n = 3). Scale bars indicate 50 μm. Colocalization of ER and mitochondria was analyzed in the merged-channel images. The white squares in the merged images indicate the zoomed regions shown for the colocalization panel; colocalization events are highlighted as white dots (see colocalization panel). (B) Colocalization events of mitochondria and ER pixel from (F) were normalized to cell number, (C) to ER area, or (D) to mitochondrial area. (E) ER area (pixel) per cell was analyzed from live cell microscopy data of ER-Tracker. (F) Mitochondrial area (pixel) per cell was analyzed from live cell microscopy data of MitoTracker Deep Red. (G) Native fibroblasts were fixed and labeled with antibodies against Tom20 (magenta) and PDI (green) for subsequent immunofluorescent microscopy analysis of mitochondria and ER colocalization. Colocalization of ER and mitochondria was analyzed in the merged-channel images. The white squares indicate the zoomed regions shown in the colocalization panel. Colocalization events are highlighted as white dots. Images were obtained with a 40 × objective. (H) Colocalization events of mitochondria and ER pixel from (G) were normalized per cell (n = 3, with approximately 80–90 cells per cell line per experiment). (I) ER area (pixel) per cell was analyzed by quantification of the PDI staining. (J) Mitochondrial area (pixel) per cell was analyzed by quantification of the Tom20 staining. Significance was calculated by the Kruskal–Wallis test (n = 3). All data indicated as mean ± SEM. **p < 0.01; ***p ≤ 0.001; ****p < 0.0001. Color images are available online.
<b>FIG. 4.</b>
FIG. 4.
Mutant Miro1 protein leads to reduction of mitochondrial mass. (A) Representative Western blot of Tom20 in immortalized fibroblasts. (B) Quantification of Tom20 protein level in immortalized fibroblasts from (A). Significance tested with the Wilcoxon test (n = 20). (C) Representative Western blot image of Hsp60 protein in immortalized fibroblasts. (D) Quantification of Hsp60 normalized to β-actin from (C). Significance assessed using the Mann–Whitney test (n = 4). (E) Representative Western blot image of Miro1 protein in immortalized fibroblasts. (F) Quantification of Western blot analysis of Miro1 protein levels from (E). Significance determined using the Wilcoxon test (n = 5). (G) Representative Western blot image of Tom20 and (I) MnSOD proteins in M17 cells with stable knockdown of endogenous RHOT1 and transiently overexpression of Miro1 variants. (−) Indicates M17 cells without knockdown of endogenous RHOT1. (+) Indicates knockdown of endogenous RHOT1 by stable transfection with the RHOT1-targeting miRNA-2471 (RHOT1 miRNA). M17 cells were transfected with Miro1-WT/myc (in pRK5-myc vector), Miro1-WT/V5, Miro1-R272Q, or Miro1-R450C (in pcDNA3.1/V5-HisA vector). (H) Quantification of Tom20 protein levels from (G) (n = 3). (J) Quantification of MnSOD protein levels from (I) (n = 3). All data indicated as mean ± SEM. *p ≤ 0.05; **p ≤ 0.01; ***p ≤ 0.001. miRNA, microRNA. Color images are available online.
<b>FIG. 5.</b>
FIG. 5.
Mitochondrial turnover is increased in Miro1-mutant fibroblasts. (A) Representative Western blot image of Miro1 in immortalized fibroblasts treated with 10 μM MG132 for 24 h or with 10 nM bafilomycinA1 for 48 h. (B) Quantification of Miro1 protein level from Western blots displayed in (A). Significance assessed with the Wilcoxon test (n = 3–7). (C) Western blot image for Tom20 protein in immortalized fibroblasts treated with 10 nM bafilomycinA1 for 48 h or with 10 μM MG132 for 24 h, respectively. (D) Quantification of Tom20 protein levels from Western blot analysis shown in (C). Significance assessed using the Wilcoxon test (n = 5). (E) Representative Western blot image of Parkin protein. Left panel shows Parkin bands in SH-SY5Y cells overexpressing Parkin. Right panel shows endogenous Parkin in immortalized fibroblasts treated with 10 μM FCCP for 14 h. (F) Quantification of Parkin protein levels normalized to β-actin from (E). Significance calculated by the Mann–Whitney test (n = 5). All data indicated as mean ± SEM. *p ≤ 0.05; **p ≤ 0.01; ***p ≤ 0.001. FCCP, carbonyl cyanide-4-(trifluoromethoxy)phenylhydrazone. Color images are available online.
<b>FIG. 6.</b>
FIG. 6.
LC3-dependent autophagy is affected in Miro1-mutant fibroblasts. (A) Representative Western blot image of immortalized fibroblasts treated with 10 nM bafilomycinA1 for 3, 6, or 24 h. (B) Densitometry analysis of Western blot for LC3-II normalized to β-actin (upper graph) and the ratio of LC3-II/LC3-I protein levels (lower graph) from (A). Significance calculated by the Friedman test (n = 3). (C) Immortalized fibroblasts were transfected with mito-DsRed and labeled with 18:1 NBD-PS. Then, cells were starved in medium without FBS for 2 h for subsequent live cell imaging, using a 63 × objective. Cell selection shows microscopy images with mito-DsRed-labeled mitochondria (red) and 18:1 NBD-PS (green). Cells were manually selected (dashed pink outline) to ensure that only 18:1 NBD-PS-labeled autophagosomes in the cytosol were analyzed. The colocalization panel shows the selected cells from the data analysis. White squares indicate the regions, which were shown in the zoom panel. Autophagosomes were identified as green particles, which are not colocalizing with the mito-DsRed signal (white arrows). (D) Quantification of autophagosome formation from images shown in (C). Significance calculated by the Wilcoxon test (n = 3). (E) Colocalization of mitochondria and LC3 pixel from (F) were quantified and normalized to cell number. Significance assessed using the Mann–Whitney test (n = 3, with ∼30 cells per cell line). (F) Immortalized fibroblasts were transfected with mito-DsRed and eGFP-LC3. Twenty-four hours after transfection, cells were treated with 25 μM CCCP or with 10 nM bafilomycinA1 for 2 or 6 h, respectively. The left panels show the microscopy images obtained with a 40 × objective. The right panels show the colocalization analysis. The outlines of analyzed mitochondria are indicated in green, whereas the outlines of analyzed LC3 puncta are indicated in red. The colocalization regions of both organelles are indicated in yellow. Scale bars indicate 20 μm. All data indicated as mean ± SEM. *p ≤ 0.05; **p ≤ 0.01; ***p ≤ 0.001; ****p < 0.0001. FBS, fetal bovine serum; PS, phosphatidylserine. Color images are available online.
<b>FIG. 7.</b>
FIG. 7.
Mutations in Miro1 lead to increased LC3-independent autophagy and impaired energy metabolism. (A) Crude mitochondrial fractions were obtained from immortalized fibroblasts. Rab9 levels were analyzed by Western blot. (B) Quantification of Rab9 protein levels in mitochondrial fractions from (A) (n = 3). (C) Representative Western blot image of Rab9 in whole cell lysates of immortalized fibroblasts treated with 10 nM bafilomycinA1 for 4 h. (D) Quantification of Rab9 protein levels from (C). Significance determined using the Wilcoxon test (n = 6–11). (E) Measurement of steady-state ATP level under baseline conditions in immortalized fibroblasts. Significance assessed with the Mann–Whitney test (n = 6). (F) Schematic overview of the mechanism of impaired ER–mitochondria contact sites and increased mitophagy in Miro1 mutant background. *p < 0.05; **p < 0.01; ***p < 0.001. Color images are available online.

Similar articles

Cited by

References

    1. Adzhubei I, Jordan DM, and Sunyaev SR. Predicting functional effect of human missense mutations using PolyPhen-2. Curr Protoc Hum Genet Chapter 7: Unit7.20, 2013 - PMC - PubMed
    1. Anvret A, Ran C, Westerlund M, Sydow O, Willows T, Olson L, Galter D, and Belin AC. genetic screening of the mitochondrial Rho GTPases MIRO1 and MIRO2 in Parkinson's disease. Open Neurol J 6: 1–5, 2012 - PMC - PubMed
    1. Basso V, Marchesan E, Peggion C, Chakraborty J, von Stockum S, Giacomello M, Ottolini D, Debattisti V, Caicci F, Tasca E, Pegoraro V, Angelini C, Antonini A, Bertoli A, Brini M, and Ziviani E. Regulation of ER-mitochondria contacts by Parkin via Mfn2. Pharmacol Res 138: 43–56, 2018 - PubMed
    1. Birsa N, Norkett R, Wauer T, Mevissen TET, Wu HC, Foltynie T, Bhatia K, Hirst WD, Komander D, Plun-Favreau H, and Kittler JT. Lysine 27 ubiquitination of the mitochondrial transport protein miro is dependent on serine 65 of the parkin ubiquitin ligase. J Biol Chem 289: 14569–14582, 2014 - PMC - PubMed
    1. Burbulla LF, Schelling C, Kato H, Rapaport D, Woitalla D, Schiesling C, Schulte C, Sharma M, Illig T, Bauer P, Jung S, Nordheim A, Schöls L, Riess O, and Krüger R. Dissecting the role of the mitochondrial chaperone mortalin in Parkinson's disease: functional impact of disease-related variants on mitochondrial homeostasis. Hum Mol Genet 19: 4437–4452, 2010 - PMC - PubMed

Publication types