

Comparing Within- and Between-Family Polygenic Score Prediction
- PMID: 31303263
- PMCID: PMC6698881
- DOI: 10.1016/j.ajhg.2019.06.006
Comparing Within- and Between-Family Polygenic Score Prediction
Abstract
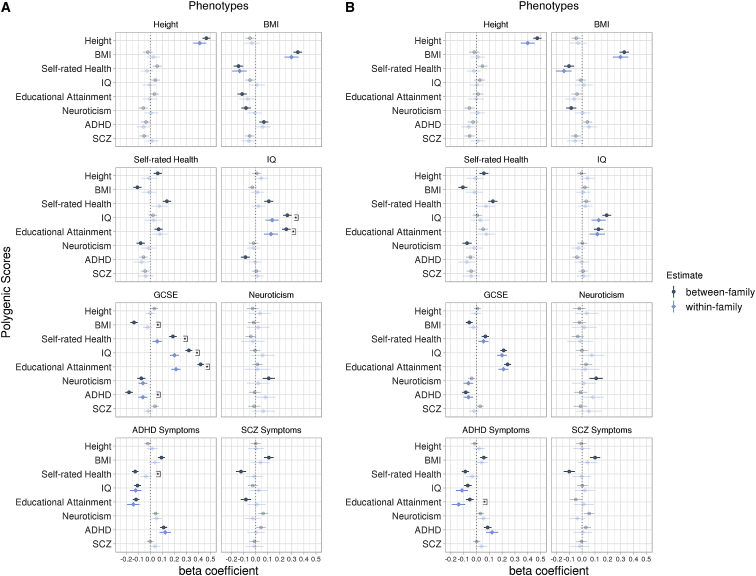
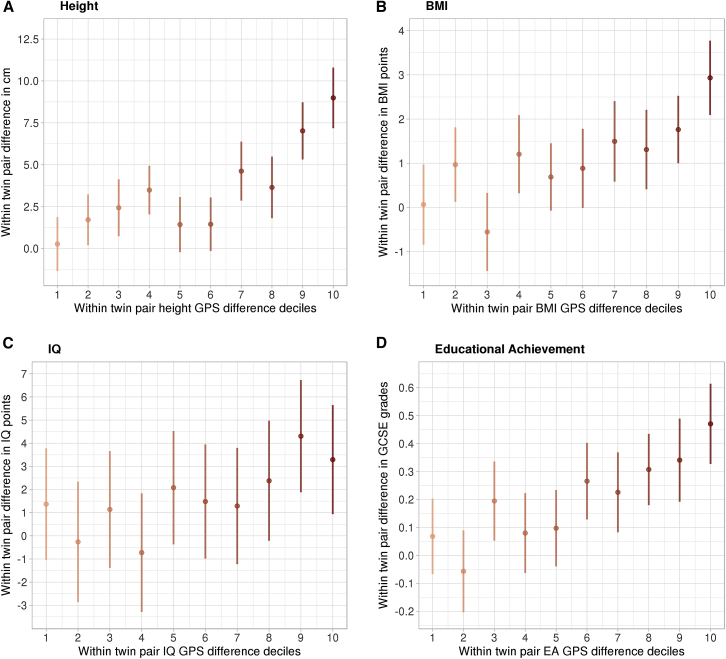
Polygenic scores are a popular tool for prediction of complex traits. However, prediction estimates in samples of unrelated participants can include effects of population stratification, assortative mating, and environmentally mediated parental genetic effects, a form of genotype-environment correlation (rGE). Comparing genome-wide polygenic score (GPS) predictions in unrelated individuals with predictions between siblings in a within-family design is a powerful approach to identify these different sources of prediction. Here, we compared within- to between-family GPS predictions of eight outcomes (anthropometric, cognitive, personality, and health) for eight corresponding GPSs. The outcomes were assessed in up to 2,366 dizygotic (DZ) twin pairs from the Twins Early Development Study from age 12 to age 21. To account for family clustering, we used mixed-effects modeling, simultaneously estimating within- and between-family effects for target- and cross-trait GPS prediction of the outcomes. There were three main findings: (1) DZ twin GPS differences predicted DZ differences in height, BMI, intelligence, educational achievement, and ADHD symptoms; (2) target and cross-trait analyses indicated that GPS prediction estimates for cognitive traits (intelligence and educational achievement) were on average 60% greater between families than within families, but this was not the case for non-cognitive traits; and (3) much of this within- and between-family difference for cognitive traits disappeared after controlling for family socio-economic status (SES), suggesting that SES is a major source of between-family prediction through rGE mechanisms. These results provide insights into the patterns by which rGE contributes to GPS prediction, while ruling out confounding due to population stratification and assortative mating.
Keywords: complex trait prediction; gene-environment correlation; gene-environment interplay; genetic nurture; polygenic score prediction; socio-economic status; within-family analysis.
Copyright © 2019 The Authors. Published by Elsevier Inc. All rights reserved.
Conflict of interest statement
The authors declare no competing interests.
Figures
Similar articles
-
Multivariable G-E interplay in the prediction of educational achievement.PLoS Genet. 2020 Nov 17;16(11):e1009153. doi: 10.1371/journal.pgen.1009153. eCollection 2020 Nov. PLoS Genet. 2020. PMID: 33201880 Free PMC article.
-
Using twin-pairs to assess potential bias in polygenic prediction of externalising behaviours across development.Mol Psychiatry. 2025 Jul;30(7):3129-3137. doi: 10.1038/s41380-025-02920-6. Epub 2025 Feb 19. Mol Psychiatry. 2025. PMID: 39972057 Free PMC article.
-
Genomic prediction of cognitive traits in childhood and adolescence.Mol Psychiatry. 2019 Jun;24(6):819-827. doi: 10.1038/s41380-019-0394-4. Epub 2019 Apr 11. Mol Psychiatry. 2019. PMID: 30971729 Free PMC article.
-
Polygenic scores: prediction versus explanation.Mol Psychiatry. 2022 Jan;27(1):49-52. doi: 10.1038/s41380-021-01348-y. Epub 2021 Oct 22. Mol Psychiatry. 2022. PMID: 34686768 Free PMC article. Review.
-
Monogenic and polygenic concepts in chronic kidney disease (CKD).J Nephrol. 2024 Jan;37(1):7-21. doi: 10.1007/s40620-023-01804-8. Epub 2023 Nov 21. J Nephrol. 2024. PMID: 37989975 Free PMC article. Review.
Cited by
-
The potential and translational application of infant genetic research.Nat Genet. 2024 Jul;56(7):1346-1354. doi: 10.1038/s41588-024-01822-7. Epub 2024 Jul 8. Nat Genet. 2024. PMID: 38977854 Review.
-
Utility of polygenic embryo screening for disease depends on the selection strategy.Elife. 2021 Oct 12;10:e64716. doi: 10.7554/eLife.64716. Elife. 2021. PMID: 34635206 Free PMC article.
-
Genetic effects on educational attainment in Hungary.Brain Behav. 2022 Jan;12(1):e2430. doi: 10.1002/brb3.2430. Epub 2021 Nov 29. Brain Behav. 2022. PMID: 34843176 Free PMC article.
-
Genome-wide analyses of variance in blood cell phenotypes provide new insights into complex trait biology and prediction.medRxiv [Preprint]. 2024 Apr 16:2024.04.15.24305830. doi: 10.1101/2024.04.15.24305830. medRxiv. 2024. Update in: Nat Commun. 2025 May 7;16(1):4260. doi: 10.1038/s41467-025-59525-4. PMID: 38699308 Free PMC article. Updated. Preprint.
-
Multivariable G-E interplay in the prediction of educational achievement.PLoS Genet. 2020 Nov 17;16(11):e1009153. doi: 10.1371/journal.pgen.1009153. eCollection 2020 Nov. PLoS Genet. 2020. PMID: 33201880 Free PMC article.
References
-
- Wray N.R., Lee S.H., Mehta D., Vinkhuyzen A.A.E., Dudbridge F., Middeldorp C.M. Research review: Polygenic methods and their application to psychiatric traits. J. Child Psychol. Psychiatry. 2014;55:1068–1087. - PubMed
-
- Plomin R. Penguin UK; 2018. Blueprint.
Publication types
MeSH terms
Grants and funding
LinkOut - more resources
Full Text Sources
Medical
