. 2019 Aug 20;51(2):351-366.e6.
doi: 10.1016/j.immuni.2019.06.006. Epub 2019 Jul 11.

Plasma Cells Are Obligate Effectors of Enhanced Myelopoiesis in Aging Bone Marrow

Affiliations

Plasma Cells Are Obligate Effectors of Enhanced Myelopoiesis in Aging Bone Marrow

Peter D Pioli et al. Immunity. .

Abstract

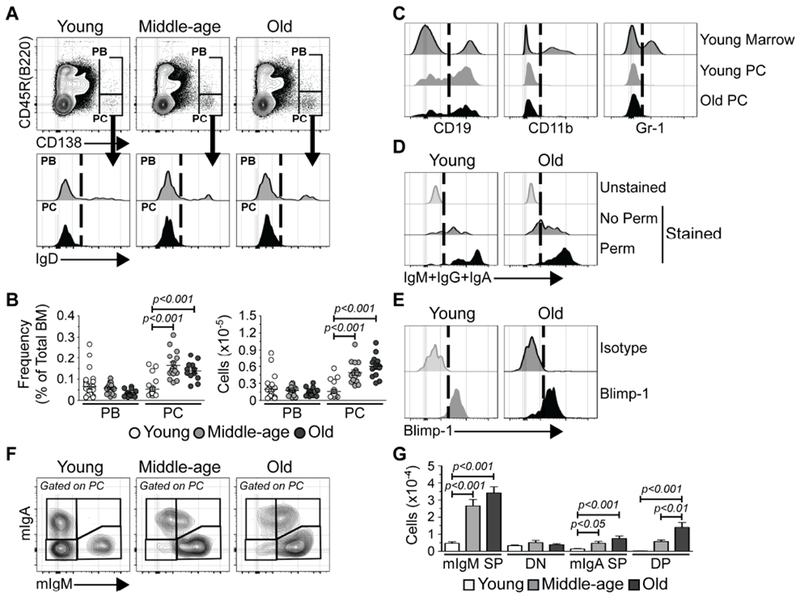
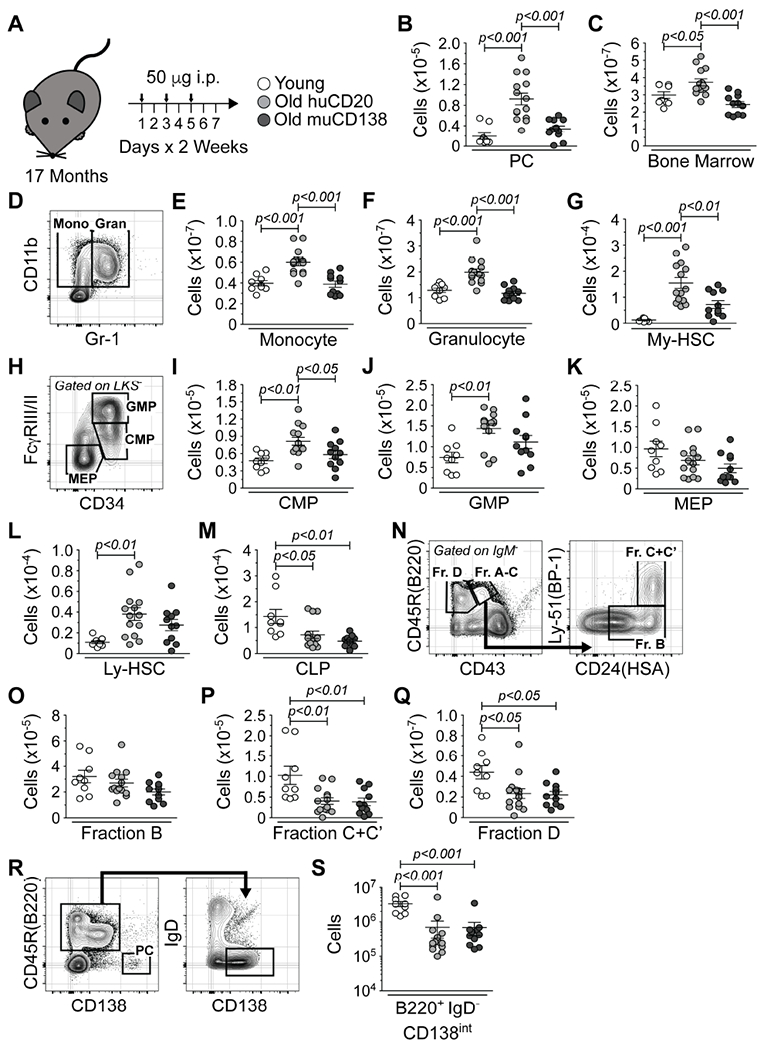
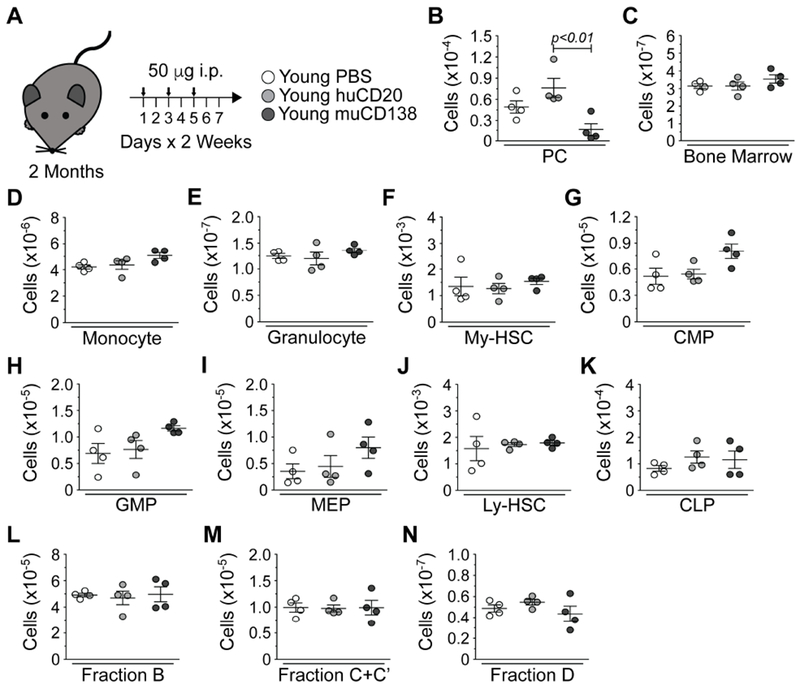
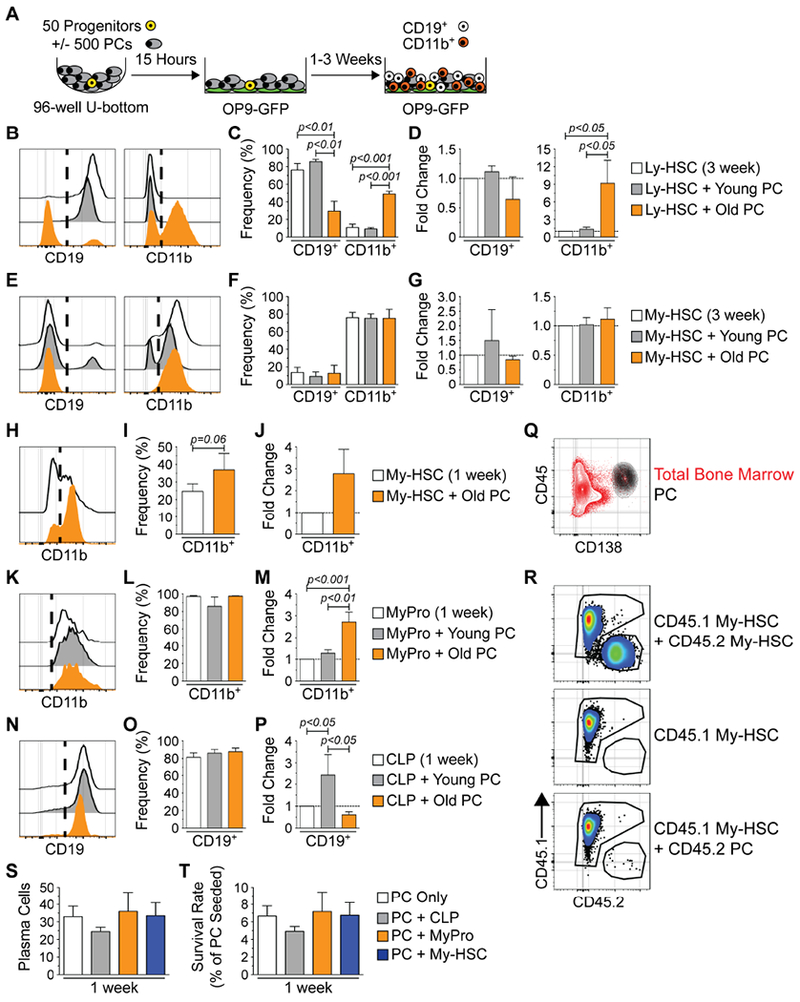
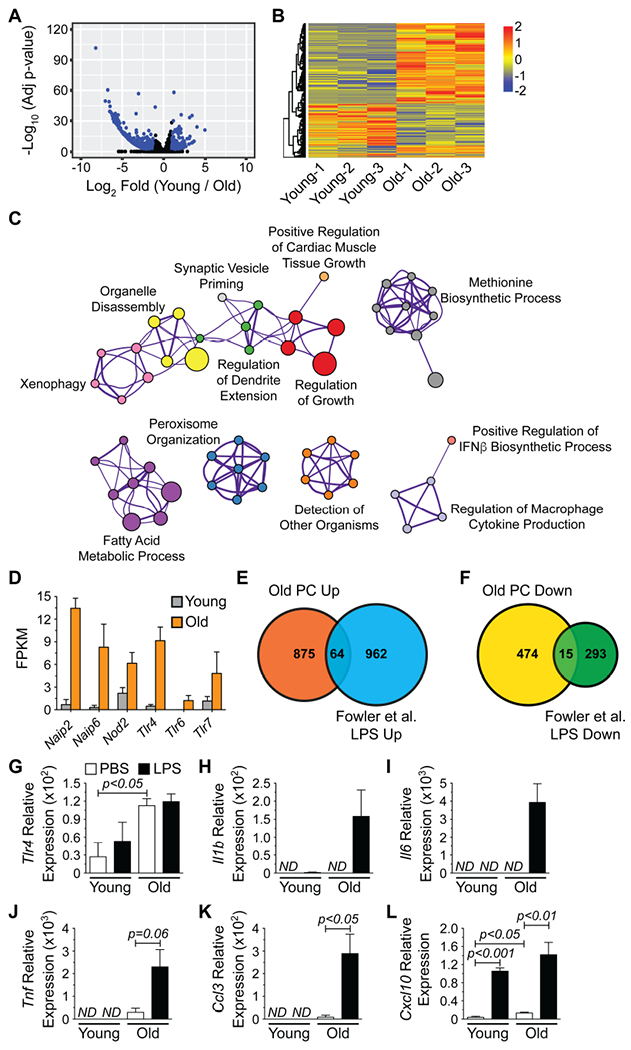
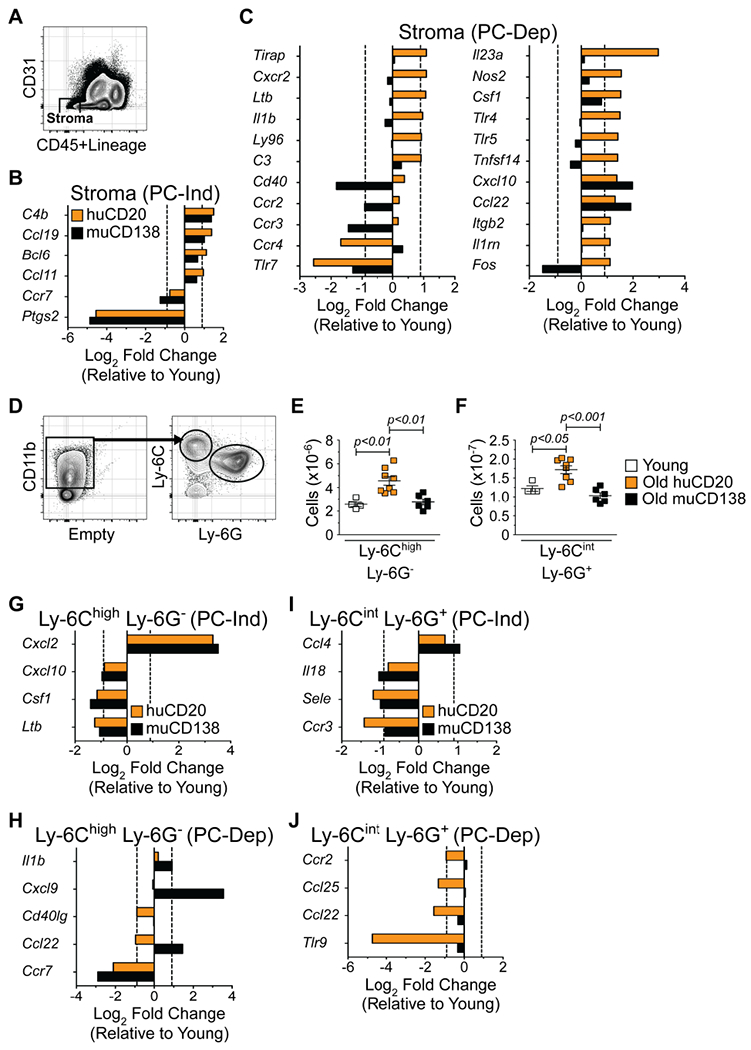
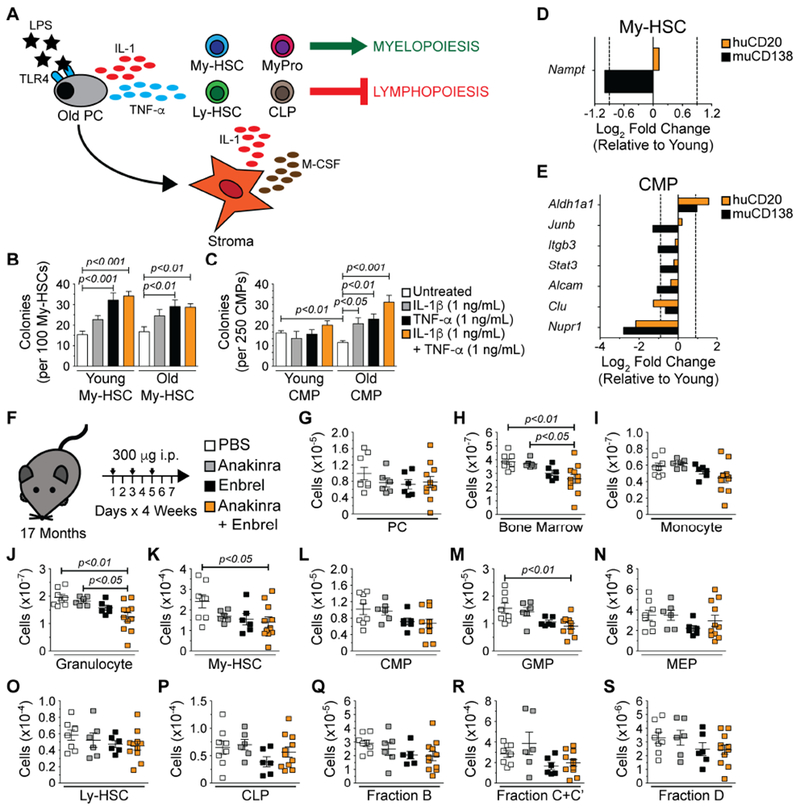
Aging results in increased myelopoiesis, which is linked to the increased incidence of myeloid leukemias and production of myeloid-derived suppressor cells. Here, we examined the contribution of plasma cells (PCs) to age-related increases in myelopoiesis, as PCs exhibit immune regulatory function and sequester in bone marrow (BM). PC number was increased in old BM, and they exhibited high expression of genes encoding inflammatory cytokines and pathogen sensors. Antibody-mediated depletion of PCs from old mice reduced the number of myeloid-biased hematopoietic stem cells and mature myeloid cells to levels in young animals, but lymphopoiesis was not rejuvenated, indicating that redundant mechanisms inhibit that process. PCs also regulated the production of inflammatory factors from BM stromal cells, and disruption of the PC-stromal cell circuitry with inhibitors of the cytokines IL-1 and TNF-α attenuated myelopoiesis in old mice. Thus, the age-related increase in myelopoiesis is driven by an inflammatory network orchestrated by PCs.

Keywords: aging; hematopoiesis; inflammaging; inflammation; interleukin-1; lymphopoiesis; myelopoiesis; plasma cell; plasmablast; tumor necrosis factor.


Conflict of interest statement

Declaration of Interests

The authors declare no competing interests.

Figures

Figure 1.
Figure 1.. PCs Accumulate in old BM
(A) Representative FACS plots depicting immunostaining of PBs and PCs in the bone marrow (BM) of young, middle-aged and old mice. (B) Frequencies and numbers of PBs and PCs in BM of young (n = 25), middle-aged (n = 16) and old (n = 13) mice. Each symbol represents an individual mouse. (C) Representative FACS plots depicting CD19, CD11b and Gr-1 immunostaining of PCs from young and old mice. Young total BM is shown for comparison. (D) Representative FACS plots depicting IgM+IgA+IgG immunostaining of PCs from young and old mice. Unstained samples are shown for comparison. No Perm = unpermeabilized; Perm = permeabilized. (E) Representative FACS plots depicting isotype control and Blimp-1 immunostaining of PCs in BM of young and old mice. (F) Representative FACS plots depicting mIgM and mIgA immunostaining of PCs in BM of young, middle-aged and old mice. (G) Numbers of SP, DN or DP mIgM+ and/or mIgA+ PCs in BM of young (n = 18), middle-aged (n = 12) and old (n = 13) mice. Bars represent mean ± SEM. (A, C-E): Vertical dashed lines on histograms depict cut-offs for positive staining. Statistics: One-way ANOVA with Bonferroni’s correction. See also Figure S1.
Figure 2.
Figure 2.. PC Depletion Reverses the Age-associated Enhancement of Myelopoiesis
(A) Schematic of antibody-mediated depletion of PCs in old mice. Arrows indicate days of injection. (B) Number of PCs in young and huCD20 and muCD138 treated old mice. (C) Total BM cellularity in young, huCD20 and muCD138 treated old mice. (D) Representative FACS plot depicting immunostaining of monocytes and granulocytes in young mice. Numbers of (E) monocytes, (F) granulocytes and (G) My-HSCs in young, huCD20 and muCD138 treated old mice. (H) Representative FACS plot from young mice depicting immunostaining of CMPs, GMPs and MEPs. Numbers of (I) CMPs, (J) GMPs and (K) MEPs in young, huCD20 and muCD138 treated old mice. (L) Numbers of Ly-HSCs and (M) CLPs in young and huCD20 and muCD138 treated old mice. (N) Representative FACS plots from young mice depicting immunostaining of pro-B and pre-B cells. Numbers of (O) Fraction B early pro-B, (P) Fraction C+C’ late pro-B/large pre-B and (Q) Fraction D small pre-B cells in young, huCD20 and muCD138 treated old mice. (R) Representative FACS plots from young mice depicting immunostaining of B220+ IgD CD138int immature B lineage cells. The PC containing gated region is provided as a reference point for CD138 staining intensity. (S) Numbers of B220+ IgD CD138int immature B lineage cells in young, huCD20 and muCD138 treated old mice. (B, C, E-G, I-M, O-Q, S) Each symbol represents an individual mouse. Animals used: Young = 9; huCD20 = 14; muCD138 = 11. Statistics: One-way ANOVA with Bonferroni’s correction. See also Figures S2 and S3.
Figure 3.
Figure 3.. PC Depletion in Young Mice Does Not Alter Hematopoiesis
(A) Schematic of antibody-mediated depletion of PCs in young mice. Arrows indicate days of injection. (B) Numbers of PCs in PBS, huCD20 and muCD138 treated young mice. (C) Total BM cellularity in PBS, huCD20 and muCD138 treated young mice. Numbers of (D) monocytes, (E) granulocytes, (F) My-HSCs, (G) CMPs, (H) GMPs, (I) MEPs, (J) Ly-HSCs, (K) CLPs, (L) Fraction B early pro-B, (M) Fraction C+C’ late pro-B/large pre-B and (N) Fraction D small pre-B cells in PBS, huCD20 and muCD138 treated young mice. Each symbol represents an individual mouse. Young = 4; huCD20 = 4; muCD138 = 4. Statistics: One-way ANOVA with Bonferroni’s correction.
Figure 4.
Figure 4.. Old PCs Enhance Myelopoiesis and Suppress Lymphopoiesis In Vitro
(A) Schematic depicting co-culture experiments utilizing PCs from young or old mice and hematopoietic progenitors from young mice. (B) Representative histograms of CD19 and CD11b expression on cells from 3 week cultures initiated with Ly-HSCs. (C) Frequencies and (D) fold change of CD19+ and CD11b+ cell production in 3 week cultures initiated with Ly-HSCs. (E) Representative histograms of CD19 and CD11b expression on cells from 3 week cultures initiated with My-HSCs. (F) Frequencies and (G) fold change of CD19+ and CD11b+ cell production in 3 week cultures initiated with My-HSCs. (H) Representative FACS histograms of CD11b expression in on cells from 1 week cultures initiated with My-HSCs. (I) Frequency and (J) fold change of CD11b+ cell production in 1 week cultures initiated with My-HSCs. (K) Representative FACS histograms of CD11b expression on cells from 1 week cultures initiated with MyPros. (L) Frequency and (M) fold change of CD11b+ cell production in 1 week cultures initiated with MyPros. (N) Representative FACS histograms of CD19 expression on cells from 1 week cultures initiated with CLPSs. (O) Frequency and (P) fold change of CD19+ cell production in 1 week cultures initiated with CLPs. (Q) Representative FACS contour plot depicting CD45 and CD138 expression in old BM. Gated PCs (black) are overlaid upon total bone marrow (red). (R) Representative FACS plots of CD45.1 and CD45.2 expression on cells harvested from 1 week cultures containing young CD45.1 My-HSCs and old CD45.2 My-HSCs (top panel), young CD45.1 My-HSCs only (middle panel) or young CD45.1 My-HSCs and old CD45.2 PCs (bottom panel). (S) Numbers of PCs remaining after 1 week in the indicated culture conditions. (T) Survival rate of PCs remaining after 1 week in the indicated culture conditions. Survival rate = (number of PCs detected / initial number of PCs seeded) × 100. (B, E, H, K, N) Vertical dashed lines on CD19 and CD11b histograms indicate cut-offs for positive staining. (C, D, F, G, I, J, L, M, O, P) Results are from a minimum of 3 experiments with 3-5 technical replicates per culture. Bars represent mean ± SEM. Statistics: For 3 groups, one-way ANOVA with Bonferroni’s correction. For 2 groups, Wilcoxon matched-pairs signed rank test. (D, G, J, M, P) Fold change was calculated using cell numbers derived from each culture condition (see Figure S4) as follows: (Progenitor + PC) / (Progenitor Only) = relative fold change. (S, T) Results are from 2 experiments with 3-4 technical replicates per culture. Bars represent mean ± SEM. See also Figures S3 and S4.
Figure 5.
Figure 5.. Old PCs Possess a Toll-like Receptor Responsive Gene Signature
(A) Volcano plot depicting RNA-seq data from young and old PCs. All expressed genes are shown and blue dots indicate genes showing significant (adjusted p-value < 0.05, Log2 fold change > |1.0|) alterations in their expression levels. (B) Heatmap of genes significantly altered between young and old PCs. (C) Cytoscape-generated network diagram summarizing GO analysis performed on genes with increased expression in old PCs using Metascape. Nodes with the same color are specific ontologies in the same GO generic class and are labeled using a representative member. Node size is proportional to the number of genes per category. Edge thickness is proportional to between-node similarity (Kappa similarity >0.3, Metascape) and reflects the overlap between the gene sets annotated in both ontology terms. (D) Fragments per kilobase of transcript length per million reads (FPKM) for pathogen receptors with significantly increased expression in old PCs. Genes were identified from (C). Bars represent mean ± SEM derived from RNA-seq data. Venn diagrams illustrating the number of genes with (E) increased or (F) decreased expression in both old PCs and LPS-stimulated B cells from (Fowler et al., 2015). (G-L) qPCR analysis for (G) Tlr4, (H) Il1b (I) Il6, (J) Tnf, (K) Ccl3 and (L) Cxcl10 expression by young and old PCs treated with PBS or LPS (1 μg/mL) for 2 hours in vitro. Results are normalized to Gapdh expression. ND = not detected. Bars represent mean ± SEM from 3 independent experiments. See also Tables S1–S2.
Figure 6.
Figure 6.. Old PCs Regulate Inflammatory Gene Expression in Stromal Cells
(A) Representative FACS plot depicting purification strategy of Lin CD45 CD31 bone marrow stromal cells. Genes differentially expressed by young and old stroma (B) independent of PCs (PC-Ind) and (C) dependent on PCs (PC-Dep). (D) Strategy for purification of BM Ly-6Chigh Ly-6G inflammatory monocytes and Ly-6Cint Ly-6G+ granulocytes. Numbers of (E) Ly-6Chigh Ly-6G inflammatory monocytes and (F) Ly-6Cint Ly-6G+ granulocytes in BM of young, huCD20 and muCD138 treated old mice. Each symbol represents an individual mouse. Animals used: Young = 4; huCD20 = 8; muCD138 = 6. Statistics: One-way ANOVA with Bonferroni’s correction. Genes differentially expressed by young and old Ly-6Chigh Ly-6G inflammatory monocytes (G) independent of PCs (PC-Ind) and (H) dependent on PCs (PC-Dep). Genes differentially expressed by young and old Ly-6Cint Ly-6G+ granulocytes (I) independent of PCs (PC-Ind) and (J) dependent on PCs (PC-Dep). Bars represent average of 2 independent experiments and show average Log2 fold changes in gene expression of samples isolated from huCD20 (orange) and muCD138 (black) treated old mice relative to their young counterparts. Sort purities of stromal cells, monocytes and granulocytes were routinely greater than 99%.
Figure 7.
Figure 7.. IL-1 and TNF-α Blockade Attenuates Myelopoiesis in Old BM
(A) Model depicting selected cytokines produced by old PCs and stromal cells and their potential hematopoietic regulatory roles. Numbers of colonies generated per (B) 100 young and old My-HSCs following 10 days in culture and (C) 250 young and old CMPs following 8 days in culture. Bars represent mean ± SEM of colonies counted per individual 3.5-cm2 dish. Data are derived from 2 independent experiments with at least 3-6 technical replicates per condition. Statistics: One-way ANOVA with Dunnett’s correction for the comparison of 3 or more groups. Unpaired Student’s t-Test for the comparison of 2 groups. Gene expression in (D) My-HSCs and (E) CMPs isolated from pools of 3-5 young, huCD2o and muCD138 treated old mice using a custom Qiagen PCR array. Bars represent average of 2 independent experiments and show average Log2 fold changes in gene expression of samples isolated from huCD20 (orange) and muCD138 (black) treated old mice relative to their young counterparts. (F) Schematic depicting experimental strategy to block IL-1 and TNF-α in old mice. Numbers of (G) PCs, (H) total BM cells, (I) monocytes, (J) granulocytes, (K) My-HSCs, (L) CMPs, (M) GMPs, (N) MEPs (O) Ly-HSCs, (P) CLPs (Q) Fraction B, (R) Fraction C+C’ and (S) Fraction D B lineage cells. Symbols in G-S represent analyses of individual mice. Animals used: PBS = 8; Anakinra = 6; Enbrel = 6; Anakinra + Enbrel = 11. Statistics: One-way ANOVA with Bonferroni’s correction.

Comment in

Similar articles

Cited by

References

    1. Alter-Wolf S, Blomberg BB, and Riley RL (2009). Old mice retain bone marrow B1 progenitors, but lose B2 precursors, and exhibit altered immature B cell phenotype and light chain usage. Mechanisms of ageing and development 130, 401–408. - PMC - PubMed
    1. Baldridge MT, King KY, and Goodell MA (2011). Inflammatory signals regulate hematopoietic stem cells. Trends in immunology 32, 57–65. - PMC - PubMed
    1. Baratono SR, Chu N, Richman LP, and Behrens EM (2015). Toll-like receptor 9 and interferon-gamma receptor signaling suppress the B-cell fate of uncommitted progenitors in mice. European journal of immunology 45, 1313–1325. - PMC - PubMed
    1. Beerman I, Bhattacharya D, Zandi S, Sigvardsson M, Weissman IL, Bryder D, and Rossi DJ (2010). Functionally distinct hematopoietic stem cells modulate hematopoietic lineage potential during aging by a mechanism of clonal expansion. Proceedings of the National Academy of Sciences of the United States of America 107, 5465–5470. - PMC - PubMed
    1. Benz C, Copley MR, Kent DG, Wohrer S, Cortes A, Aghaeepour N, Ma E, Mader H, Rowe K, Day C, et al. (2012). Hematopoietic stem cell subtypes expand differentially during development and display distinct lymphopoietic programs. Cell stem cell 10, 273–283. - PubMed

Publication types