. 2019 Aug 12;36(2):123-138.e10.
doi: 10.1016/j.ccell.2019.06.007. Epub 2019 Jul 11.

Mechanisms of Progression of Myeloid Preleukemia to Transformed Myeloid Leukemia in Children with Down Syndrome

Affiliations

Mechanisms of Progression of Myeloid Preleukemia to Transformed Myeloid Leukemia in Children with Down Syndrome

Maurice Labuhn et al. Cancer Cell. .

Erratum in

  • Mechanisms of Progression of Myeloid Preleukemia to Transformed Myeloid Leukemia in Children with Down Syndrome.
    Labuhn M, Perkins K, Matzk S, Varghese L, Garnett C, Papaemmanuil E, Metzner M, Kennedy A, Amstislavskiy V, Risch T, Bhayadia R, Samulowski D, Hernandez DC, Stoilova B, Iotchkova V, Oppermann U, Scheer C, Yoshida K, Schwarzer A, Taub JW, Crispino JD, Weiss MJ, Hayashi Y, Taga T, Ito E, Ogawa S, Reinhardt D, Yaspo ML, Campbell PJ, Roberts I, Constantinescu SN, Vyas P, Heckl D, Klusmann JH. Labuhn M, et al. Cancer Cell. 2019 Sep 16;36(3):340. doi: 10.1016/j.ccell.2019.08.014. Cancer Cell. 2019. PMID: 31526763 No abstract available.

Abstract

Myeloid leukemia in Down syndrome (ML-DS) clonally evolves from transient abnormal myelopoiesis (TAM), a preleukemic condition in DS newborns. To define mechanisms of leukemic transformation, we combined exome and targeted resequencing of 111 TAM and 141 ML-DS samples with functional analyses. TAM requires trisomy 21 and truncating mutations in GATA1; additional TAM variants are usually not pathogenic. By contrast, in ML-DS, clonal and subclonal variants are functionally required. We identified a recurrent and oncogenic hotspot gain-of-function mutation in myeloid cytokine receptor CSF2RB. By a multiplex CRISPR/Cas9 screen in an in vivo murine TAM model, we tested loss-of-function of 22 recurrently mutated ML-DS genes. Loss of 18 different genes produced leukemias that phenotypically, genetically, and transcriptionally mirrored ML-DS.

Keywords: Acute myeloid leukemia; CRISPR screen; Down syndrome; GATA1; cancer transformation; preleukemia.


Conflict of interest statement

DECLARATION OF INTERESTS

D.R. has consulting/advisory roles for Roche, Celgene, Hexal, Pfizer, Novartis, and Boehringer, and receives Celgene research funding. D.R. received travel, accommodation, and expenses from Jazz Pharmaceuticals and Griffols. J.D.C. receives research funding from Scholar Rock and Forma Therapeutics. All other authors declare no competing interests.

Figures

Figure 1.
Figure 1.. Acquired Genetic Variant Landscape in ML-DS and TAM
Sequencing data from 141 ML-DS samples and 111 TAM samples. Samples are arranged in columns with genes labeled and grouped in rows. Deletion of chromosome 5q (del5q) is indicated. Samples subject to exome sequencing are shown at the bottom. Total number of variants per gene is indicated on the right. Where more than one variant was detected in a sample, the colored boxes are stacked rectangles. The predicted nature and function of variant is color coded. The code is shown at the bottom of the figure. Tr. factor, transcription factor. The p value is calculated by two-tailed paired Student’s t test relative to non-GATA1 variants present in ML-DS versus TAM cases. See also Figures S1 and S2; Table S1.
Figure 2.
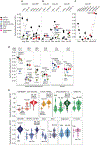
Figure 2.. Clonal and Subclonal Evolution in ML-DS and TAM
(A–C) Plots of variant allele frequency (VAF) adjusted to copy number in sequential samples (day or month of life from birth) from patients with TAM that progressed (prog) within 3 months of birth. With TAM (A) that transformed to ML-DS (B); and a patient with TAM who progressed to ML-DS, relapsed after chemotherapy, and died (C). Circles, mean VAF; error lines represent SD. Left of (A) is color-coded key to classes of mutations. (D) VAF for six representative ML-DS cases. Percentage of blasts in the sample is shown on top. Circles, mean VAF; vertical bars, 95% confidence intervals. p values are from two-tailed paired Student’s t test relative to GATA1. (E) Bean plot of variant distribution relative to GATA1 VAF. Gray horizontal lines indicate mean; black or white smaller horizontal lines represent individual data points; polygons represent estimated data density. p values (p < 0.05) were obtained from two-tailed paired Student’s t test. TK, tyrosine kinase; Tr.factor, transcription factor. See also Figure S2; Tables S1 and S2.
Figure 3.
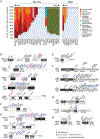
Figure 3.. Predicted Functional Nature and Distribution of Variants within More Commonly Mutated Genes in TAM and ML-DS
(A) Column graph of frequency and type of non-GATA1 variants in ML-DS and TAM samples for the indicated genes. Predicted functional consequence of variant is color coded; legend on the right. Values within columns show number of variants annotated within each functional category. Large deletion refers to entire gene loss. (B–H) Schematic of amino acid position of variants, predicted amino acid changes of common variants in TAM and ML-DS divided by functional categories: cohesin family members (B), SH2B3 adaptor protein (C), epigenetic regulators (D), SRSF2 splicing factor protein (E), JAK kinase family members (F), cytokine receptors including CSFR2B (G), and RAS family members (H). Protein binding recognition regions in black, conserved domain motifs in gray. Position of TAM (red arrowhead) and ML-DS (black arrowhead) variants are shown. Previously undocumented variants, blue text; previously documented variants, black text. Positions of sgRNAs used in CRISPR/Cas9 experiments are in pink font. *, stop codon; fs, frameshift; SA, splice acceptor variant; SD, splice donor variant. Cytogenetic abnormalities leading to loss of heterozygosity are denoted. Functionally validated gain-of-function variants in this or other studies is denoted by green circle. ATPase, ATP-binding Walker A (N-terminal) and B (C-terminal); SCD, STAG (Stromal Antigen) Conserved Domain; PDS5B/WAPAL, sister chromatid cohesion protein PDS5 homolog B/Wings Apart-Like binding sites; SA1/2, STAG1/2 binding sites; FERM, Four.1-Ezrin-Radixin-Moesin plasma membrane localization motif; ps.kinase JH1, pseudokinase JH1; SH2, Src Homology 2 domain; KAT8, lysine acetyltransferase 8 domain; HAT, histone acetyltransferase domain; trans, transmembrane domain. See also Figure S3 and Table S1.
Figure 4.
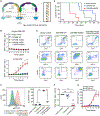
Figure 4.. CSF2RB A455D Confers Cytokine-Independent JAK-STAT Signaling and Impairs Megakaryocytic Differentiation
(A) Model of common receptor β chain encoded by CSF2RB together with possible α chains. The A455D variant is in the transmembrane domain. (B) Ratio of transduced (CSF2RB A445D, CSF2RB WT, and empty vector) to untransduced TF1 cells cultured in the presence (upper panel) or absence (lower panel) of GM-CSF normalized to day 0 (n = 3). Additionally, CSF2RB A455D-expressing cells were treated with the JAK2-inhibitor ruxolitinib (1 μM). Data are presented as mean ± SEM. *p ≤ 0.05; **p ≤ 0.01 (unpaired t test). (C) Representative flow cytometry (FACS) histogram (left) and statistics (right) of phosphorylated STAT5 (pSTAT5) in transduced TF1 cells without GM-CSF stimulus (n = 3). Horizontal bars represent means; **p ≤ 0.01 (unpaired t test). (D) Kaplan-Meier survival curve of NSG mice transplanted with CSF2RB A445D, CSF2RB WT, or empty vector-transduced TF1 cells. **p ≤ 0.01 (log-rank test compared with CSF2RB A445D group). (E) Representative FACS plots of transduced human cord blood-derived CD34+ HSPCs grown in megakaryocytic differentiation medium with and without the JAK2 inhibitor ruxolitinib after 12 days of culture. (F) Percentage of mature megakaryocytic cells (CD41+CD42b+) as depicted in first row of (E) normalized to empty vector-transduced control cells. Horizontal bars represent means; **p ≤ 0.01 (unpaired t test and one-sample t test for normalized data). (G) Cell count of human HSPCs grown in megakaryocytic differentiation medium normalized to day 0. Data are presented as mean ± SEM. *p ≤ 0.05 (unpaired t test). See also Figure S4.
Figure 5.
Figure 5.. CRISPR/Cas9 Loss-of-Function Gata1s Mutations in Murine FLCs Generate ML-DS-like Leukemias
(A) Schematic of in vivo multiplexed CRISPR/Cas9 approach to model and progression of TAM to ML-DS. (B) Kaplan-Meier survival curve of recipients transplanted with GATA1s-expressing FLCs transduced with sgRNA libraries. **p ≤ 0.01 (log-rank test). (C) Representative FACS plots of bone marrow-derived leukemic cells. (D) Percentage of bone marrow leukemic cells in Gata1s-FLCs. Monocytes, CD11b+/Gr1; granulocytes, CD11b+/Gr1+. Data are presented as means ± SD. (E) Heatmap and unsupervised hierarchical clustering of RNA-seq data, using the 1,613 most variable genes (standard deviation >1) across six murine bone marrow samples from mice with leukemia and FACS-sorted normal murine fetal liver LSKs, CMPs, GMPs, and MEPs. (F) Bar graph showing normalized enrichment scores from GSEA of significantly up- or downregulated gene sets from previously derived ML-DS and other signatures (Bourquin et al., 2006; Schwarzer et al., 2017) in the murine leukemia samples compared with normal progenitor populations. *False discovery rate (FDR) q value <0.25, **FDR q value <0.05. See also Figure S5 and Table S3.
Figure 6.
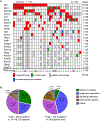
Figure 6.. CRISPR/Cas9 In Vivo Screening Reveals Driving Mutations in ML-DS
(A) Nonsense/missense, frameshift, and in-frame mutations or insertions/deletions (indels) (n = 104) detected in 38 mice with leukemia where sufficient material was available (out of 50 leukemic mice). Mice are arranged in columns, genes labeled and grouped along rows. (B) Pie charts depicting relative frequency of mutations in functional categories of genes in TAM/ML-DS patient cohort in this work (left) and mouse cohort (right). Percentages and absolute numbers of cases are shown. See also Figure S6 and Table S4.

Comment in

Similar articles

Cited by

References

    1. Ahmed M, Sternberg A, Hall G, Thomas A, Smith O, O’Marcaigh A, Wynn R, Stevens R, Addison M, King D, et al. (2004). Natural history of GATA1 mutations in Down syndrome. Blood 103, 2480–2489. - PubMed
    1. Aken BL, Achuthan P, Akanni W, Amode MR, Bernsdorff F, Bhai J, Billis K, Carvalho-Silva D, Cummins C, Clapham P, et al. (2017). Ensembl 2017. Nucleic Acids Res. 45, D635–D642. - PMC - PubMed
    1. Alford KA, Reinhardt K, Garnett C, Norton A, Bohmer K, von Neuhoff C, Kolenova A, Marchi E, Klusmann JH, Roberts I, et al. (2011). Analysis of GATA1 mutations in Down syndrome transient myeloproliferative disorder and myeloid leukemia. Blood 118, 2222–2238. - PubMed
    1. Andersson AK, Ma J, Wang J, Chen X, Gedman AL, Dang J, Nakitandwe J, Holmfeldt L, Parker M, Easton J, et al. (2015). The landscape of somatic mutations in infant MLL-rearranged acute lymphoblastic leukemias. Nat. Genet 47, 330–337. - PMC - PubMed
    1. Bailey MH, Tokheim C, Porta-Pardo E, Sengupta S, Bertrand D, Weerasinghe A, Colaprico A, Wendl MC, Kim J, Reardon B, et al. (2018). Comprehensive characterization of cancer driver genes and mutations. Cell 173, 371–385.e18. - PMC - PubMed

Publication types

MeSH terms

Supplementary concepts