. 2019 Sep 3;30(3):525-538.e8.
doi: 10.1016/j.cmet.2019.06.014. Epub 2019 Jul 11.

Oncogene Amplification in Growth Factor Signaling Pathways Renders Cancers Dependent on Membrane Lipid Remodeling

Affiliations

Oncogene Amplification in Growth Factor Signaling Pathways Renders Cancers Dependent on Membrane Lipid Remodeling

Junfeng Bi et al. Cell Metab. .

Abstract

Advances in DNA sequencing technologies have reshaped our understanding of the molecular basis of cancer, providing a precise genomic view of tumors. Complementary biochemical and biophysical perspectives of cancer point toward profound shifts in nutrient uptake and utilization that propel tumor growth and major changes in the structure of the plasma membrane of tumor cells. The molecular mechanisms that bridge these fundamental aspects of tumor biology remain poorly understood. Here, we show that the lysophosphatidylcholine acyltransferase LPCAT1 functionally links specific genetic alterations in cancer with aberrant metabolism and plasma membrane remodeling to drive tumor growth. Growth factor receptor-driven cancers are found to depend on LPCAT1 to shape plasma membrane composition through enhanced saturated phosphatidylcholine content that is, in turn, required for the transduction of oncogenic signals. These results point to a genotype-informed strategy that prioritizes lipid remodeling pathways as therapeutic targets for diverse cancers.

Keywords: cancer dependency; cancer metabolism; gene amplification; growth factor signaling; membrane lipid remodeling.


Conflict of interest statement

Declaration of Interests

PSM is co-founder of Pretzel Therapeutics, Inc. He has equity and serves as a consultant for the company. PSM also did a one-time consultation for Abide Therapeutics, Inc.

Figures

Figure 1.
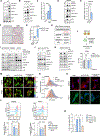
Figure 1.. EGFRvIII Signaling Activates Membrane Phospholipid Remodeling of Cancer Cells through LPCAT1
(A) Lipidomics analysis of phospholipids in U87EGFRvIII and U87 cells. Values are shown as log2 fold change relative to U87 cells. Each dot represents one lipid species. Dot color shows lipid class and dot size indicates significance. (B) Percentage of phosphatidylcholine (PC) with different saturation indexes in U87EGFRvIII and U87 cells. Saturation index (n) of PC was calculated by the total numbers of carbon double bonds contained in two fatty acyl chains. n = 0 represents saturated PC. (C) Heatmap of phospholipid changes in U87EGFRvIII cells expressing non-targeting control and LPCAT1 shRNA. Color Scale represents log2 fold change of lipid abundance relative to shNT control. Five replicates for each group were performed. Three saturated PCs, PC28:0, PC30:0 and PC32:0 are labeled. (D) Lipid-lipid interaction network in EGFRvIII-expressing cancer cells. Pearson’s correlations between pairs of lipids were calculated based on their relative abundance over fifteen independent experiments of (C) and represented by edge darkness. Edges with r >= 0.7 are visualized. Node color represents log2 fold change of lipid abundance relative to control. The network is visualized in Cytoscape (Shannon et al., 2003). (E) The abundance (pmol/ million cells) of three saturated phosphatidylcholine PC28:0, PC30:0 and PC32:0 in U87EGFRvIII cells expressing control and LPCAT1 shRNA. Data represent mean SEM. (F) Schematic model for LPCAT1 function in phospholipid remodeling converting lysophosphatidylcholine (LPC) to saturated PC, including PC28:0, PC30:0 and PC32:0, in cancer cells. (G) Percentage of phosphatidylcholine with different saturation indexes in total PC. The saturation index of PC was calculated by the total numbers of carbon double bonds contained in two fatty acyl chains. Data represent mean ± SD. Statistical analysis was performed with student’s t test for (A), and one-way ANOVA plus a Tukey’s multiple comparisons test for (B), and two-way ANOVA plus a Dunnett’s multiple comparisons test for (E) and (G). ***p < 0.001, **p < 0.01. See also Figure S1 and Table S1.
Figure 2.
Figure 2.. LPCAT1 Is Highly Upregulated in EGFR-activated GBM Samples, and Is Required for EGFR Signaling
(A) Western blot analysis of LPCAT1 expression and EGFR signaling in normal human astrocytes (NHA), U87 and U87EGFRvIII cells. (B) Western blot analysis of LPCAT1 expression and EGFR signaling in U87cells expressing EGFR with or without EGF (20 ng/ml) stimulation for 24 hours. (C) Relative mRNA level of LPCAT1 in normal human astrocytes (NHA), U87 and U87EGFRvIII cells. Data represent mean ± SD. (D) Western blot analysis of LPCAT1 expression and EGFR signaling in normal human astrocytes (NHA) and patient-derived neurosphere GBM39 cells treated with DMSO or erlotinib (10 μM) for 48 hours. Erlotinib is an inhibitor to block EGFR signaling. (E) Relative mRNA level of LPCAT1 in GBM39 cells treated with DMSO or erlotinib (10 μM) for 48 hours. Data represent mean ± SD. (F) Representative images of immunohistochemistry (IHC) staining for LPCAT1 in GBM patient tumor samples (n =70) and adjacent normal brain tissue cores (n = 27) and. Scale bar, 50 μm. (G) Quantification of LPCAT1 IHC staining in GBM tissue microarray samples. Numbers of samples with LPCAT1 high or low staining intensity are shown. (H) LPCAT1 protein level is correlated with EGFR signaling in GBM patient samples. Intensity of IHC staining for indicated proteins was scored and quantified. (I) Western blot analysis of EGFR signaling in U87EGFRvIII, GBM39 and HK301 cells expressing control and LPCAT1 shRNA. (J) Western blot analysis of EGFR signaling in U87EGFRvIII cells expressing control and LPCAT1 shRNA. Cells were treated with vehicle control or 10 M of DPPC (PC16:0/16:0) liposomes. (K) Western blot analysis of EGFR signaling in U87EGFRvIII cells transfected with negative control and LPCAT1 siRNA. Cells were treated with vehicle control or 20 M of palmitate (C16:0 FA). (L) Membrane order changes of giant plasma membrane vesicles (GPMVs) isolated from U87 cells or U87EGFRvIII cells expressing control or LPCAT1shRNA. General polarization (GP) values were determined by laurdan staining. Data represent mean SEM. (M) Laurdan imaging analysis of membrane lipid order in GBM39 and HK301 cells expressing control and LPCAT1 shRNA. 10 M of DPPC liposomes was added to rescue membrane order after LPCAT1 depletion. Merged mean intensity and rainbow RGB pseudocolored GP images are shown. Red colors indicate high membrane order and less membrane dynamic, whereas blue colors indicate low order and high membrane dynamic. Arrowheads point to plasma membrane. Scale bar, 20 μm. (N) Distribution of the GP values in GBM39 and HK301 cells in (M). The histograms for GBM cells with LPCAT1 knockdown are shifted to low GP values. (O) Immunofluorescence staining of EGFRvIII in GBM39 and HK301 cells expressing control and LPCAT1 shRNA. 10 M of DPPC liposomes was added to rescue EGFRvIII localization after LPCAT1 depletion. Arrowheads point to plasma membrane staining of EGFRvIII. Nuclei were stained with DAPI (blue). Scale bar, 20 μm. (P) Flow cytometry analysis of cell surface EGFR in GBM39 and HK301 cells with indicated treatment. 10 M of DPPC liposomes was added after LPCAT1 depletion in rescue groups. Cells only stained with secondary antibody were performed as the negative control (NC). Data represent mean SEM. (Q) Fold change of internalized surface EGFR in U87EGFRvIII cells expressing control and LPCAT1 shRNA after 10-minutes internalization at 37 ?. Data represent mean SEM. 10 M of DPPC liposomes was added after LPCAT1 depletion in the rescue group. Statistical analysis was performed with Fisher’s exact test for (G) and (H), and Student’s t test for (C), (E), (L) (P) and (Q). ***p < 0.001, **p < 0.01;*p < 0.05. See also Figure S2.
Figure 3.
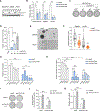
Figure 3.. LPCAT1-mediated Phospholipid Saturation Promotes Cancer Cell Proliferation and Survival
(A) Knockdown efficiency of LPCAT1 shRNAs in three GBM cancer cell lines. (B) Relative cell viability of U87EGFRvIII, GBM39 and HK301 cells expressing control and LPCAT1 shRNA. (C) Colony formation assay was performed in soft agar for U87EGFRvIII cells expressing control and LPCAT1 shRNA. A shRNA-resistant form of LPCAT1 was expressed in cancer cells with #1 shRNA. (D) Quantification of colony numbers in (C). (E) Representative sphere images of two patient-derived neurosphere lines GBM39 and HK301 expressing control and LPCAT1 shRNA. Scale bar, 250 μm. (F) Quantification of sphere diameters of (E). The median value (center line), the min and max (whiskers), and the 25th and 75th percentiles (box perimeters) are presented. Each dot represents one sphere. (G) Relative cell viability of LPCAT1 knockdown and control U87EGFRvIII cells with 10 M indicated lipids or vehicle treatments. Liposomes of indicated PCs were generated and treated to cells. DPPC, PC16:0/16:0; POPC, PC16:0/18:1; PAPC, PC16:0/20:4. (H) Colony formation assay was performed in soft agar for U87EGFRvIII cell expressing control and LPCAT1 shRNA with 10 M of lipids or vehicle treatments. Liposomes of indicated PCs were generated and treated to cells. (I-J) Colony formation assay was performed in soft agar for U87EGFRvIII cells expressing indicated shRNA or vectors. An empty vector or a vector expressing a constitutively active form of AKT with E17K mutation was stably transfected into the indicated cells. (K) Relative cell viability of U87EGFRvIII cells expressing indicated shRNA or vectors. Data represent mean ± SD except (F). Statistical analysis was performed with one-way ANOVA for (B), (F), (J) and (K), two-way ANOVA plus a Tukey’s multiple comparisons test for (G) and (H), and Student’s t test for (D). ***p < 0.001, **p < 0.01, *p < 0.05, NS, not significant. See also Figure S3.
Figure 4.
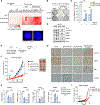
Figure 4.. LPCAT1 Depletion Suppresses Tumor Growth and Prolongs the Survival of Mice Bearing Intracranial Patient-Derived GBMs
(A). Schematic of genetic depletion of LPCAT1 in the patient-derived GBM orthotopic xenograft model using doxycycline-inducible shRNA. Patient-derived neurosphere GBM39 cells, engineered to carry for both near-infrared fluorescent protein 720 (IRFP 720) and inducible shRNA, were orthotopically injected into five-week old nu/nu mice (n=7 for each group). Dox diet was given at day 4 after injection. (B) Representative FMT tumor images of mice at week 8 after injection shows inducible knockdown of LPCAT1 suppresses GBM tumor growth. Scale bar, 3.8 mm. (C) Tumor growth curves for mice bearing GBM with inducible expression of non-targeting control or LPCAT1 shRNA. Error bars represent ± SD. (D) IHC staining of tumor samples of (C) with indicated antibodies. Scale bar, 50 μm. (E) Quantification of the IHC staining in (D). (F) Kaplan-Meier curves for the overall survival of mice from (C). p = 0.0013. Data represent mean ± SD. Statistical analysis was performed with Student’s t test for (E), Two-way ANOVA with a post Tukey’s multiple comparisons test for (C), and Log-rank test for (F). ***p < 0.001, **p < 0.01. See also Figure S4.
Figure 5.
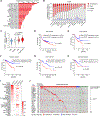
Figure 5.. LPCAT1 Is Frequently Amplified and Associated with Shorter Patient Survival in Cancer
(A) Amplification frequency of LPCAT1 across cancers in publically available cancer sequencing databases of clinical samples. Cancer types with over 2.5% amplification are shown. (B) Copy-number alternations of LPCAT1 across cancers in TCGA datasets. LPCAT1 copy number is increased in over 30% of pan-cancer patients. (C) Violin plots of LPCAT1 mRNA expression (z-scores) versus copy numbers in Cancer Cell Line Encyclopedia (CCLE) cell lines. The median value (center line) and the 25th and 75th percentiles (dash lines) are presented. (D-E) The disease-free survival of patients with high or low LPCAT1 expression in pan-cancer (D) and pan-lung cancer (E) from TCGA cancer data sets. The high or low LPCAT1 expression was defined as a value in the top quartile or bottom quartile of the set, respectively. (F-H) The overall survival of patients with high or low LPCAT1 expression in kidney cancer, liver cancer and cervical cancer from TCGA cancer data sets. The high or low LPCAT1 expression was defined as in (D-E). (I) Heatmap of gene amplification frequency of LPCAT1–4 in TCGA cancer datasets. (J) Genomic alternations of LPCAT1 and genes in growth factor pathways in TCGA pan-cancer datasets. Indicated gene alternations across 10,967 patient samples from 33 cancer types in TCGA pan-cancer datasets were analyzed by using cBioPortal. Only patient samples with genomic alternations in LPCAT1 were visualized. Statistical analysis was performed with one-way ANOVA plus a post Tukey’s multiple comparisons test for (C), Log-rank test for (D-H), and Fisher’s exact test for (J). See also Figure S5 and Table S2.
Figure 6.
Figure 6.. LPCAT1 Depletion Effectively Kills a Wide Variety of LPCAT1 Copy-number Increased Cancers via Its Effect on Saturated PC Synthesis
(A) Cell viability of 2 non-cancer cell lines and 18 cancer cell lines expressing control and LPCAT1 shRNA. Cell viability data was normalized with control. LPCAT1 copy number of two representative cancer cell lines (H1437 and HCC1954) with LPCAT1-amplification was validated by FISH with a LPCAT1-specific probe (red). Nuclear DNA was counterstained with DAPI (blue). Scale bar, 5 μm. (B) Colony formation of control and LPCAT1 knockdown H1437 cells treated with vehicle or 10 M of DPPC liposomes. (C) Quantification of colony density in (B). Percentage of colony density relative to control cells with vehicle treatment are shown. Error bars represent ± SD. (D) Western blot analysis of H1437 cells expressing doxycycline-induced shRNAs with indicated antibodies. (E) Schematic of genetic depletion of LPCAT1 in LPCAT1-amplified cancer models using doxycycline-inducible shRNA system. LPCAT1-amplified cancer cell lines, engineered to carry inducible shRNA, were subcutaneously injected into five-week old nu/nu mice (n=8 for each group). Dox diet was given after tumors were established at day 4 after implantation. (F) Tumor growth of mice carrying LPCAT1-amplified lung cancer cell H1437 xenografts expressing non-targeting or LPCAT1-targeting inducible shRNA. Flag-tagged LPCAT1 was expressed in the rescue group with LPCAT1#1 inducible shRNA that targets to 3’UTR region of LPCAT1. Error bars represent SEM. Two representative tumor images for each group are shown. Scale bar, 10 mm. (G) IHC staining of H1437 xenograft tumor samples with indicated antibodies. Scale bar, 50 μm. (H) Quantification of the IHC staining in (G). Data represent mean ± SD. (I) Tumor growth of mice subcutaneously implanted with LPCAT1-gained A498 renal cancer cells. n = 8 for each group. Dox diet was given to mice after tumors were established at day 4 after implantation. Error bars represent SEM. Statistical analysis was performed with two-way ANOVA plus a Tukey’s multiple comparisons test for (C), (F) and (I), and one-way ANOVA with a Tukey’s multiple comparisons test for (H). ***p < 0.001, **p < 0.01, *p < 0.05, NS, not significant. See also Figure S6.
Figure 7.
Figure 7.. Proposed Model - LPCAT1 Links Genetic Alterations of Key Components of the Growth Factor Receptor Machinery with Plasma Membrane Remodeling to Drive Tumor Growth, Generating an Actionable Dependency across Cancers.
EGFR amplification/ mutations, the most common growth factor receptor alternations in cancer (over 50% in GBMs), upregulates LPCAT1 and activates membrane lipid remodeling pathway in GBM. LPCAT1 itself was also found frequently amplified across cancers, including lung cancers, ovarian cancers, bladder cancers, and invasive breast cancers, with a DNA copy-number increase in about 30% TCGA reported pan-cancer patients. Significant co-occurrence of genomic alternations between LPCAT1 and genes in growth factor pathways was identified in TCGA pan-cancer datasets containing a total of 10,967 patient samples from 33 cancer types. LPCAT1-mediated phospholipid remodeling further supports the sustained oncogenic activity of grow factor receptors on plasma membrane of tumor cells both in vitro and in vivo, generating an actionable dependency across cancers.

Comment in

References

    1. Abdelzaher E, and Mostafa MF (2015). Lysophosphatidylcholine acyltransferase 1 (LPCAT1) upregulation in breast carcinoma contributes to tumor progression and predicts early tumor recurrence. Tumour biology : the journal of the International Society for Oncodevelopmental Biology and Medicine 36, 5473–5483. - PubMed
    1. Abercrombie M, and Ambrose EJ (1962). The surface properties of cancer cells: a review. Cancer research 22, 525–548. - PubMed
    1. Arkhipov A, Shan Y, Das R, Endres NF, Eastwood MP, Wemmer DE, Kuriyan J, and Shaw DE (2013). Architecture and membrane interactions of the EGF receptor. Cell 152, 557–569. - PMC - PubMed
    1. Bridges JP, Ikegami M, Brilli LL, Chen X, Mason RJ, and Shannon JM (2010). LPCAT1 regulates surfactant phospholipid synthesis and is required for transitioning to air breathing in mice. The Journal of clinical investigation 120, 1736–1748. - PMC - PubMed
    1. Cerami E, Gao J, Dogrusoz U, Gross BE, Sumer SO, Aksoy BA, Jacobsen A, Byrne CJ, Heuer ML, Larsson E, et al. (2012). The cBio cancer genomics portal: an open platform for exploring multidimensional cancer genomics data. Cancer discovery 2, 401–404. - PMC - PubMed

Publication types

MeSH terms

Substances