

Tobacco smoking induces changes in true DNA methylation, hydroxymethylation and gene expression in bronchoalveolar lavage cells
- PMID: 31303497
- PMCID: PMC6710853
- DOI: 10.1016/j.ebiom.2019.07.006
Tobacco smoking induces changes in true DNA methylation, hydroxymethylation and gene expression in bronchoalveolar lavage cells
Abstract
Background: While smoking is known to associate with development of multiple diseases, the underlying mechanisms are still poorly understood. Tobacco smoking can modify the chemical integrity of DNA leading to changes in transcriptional activity, partly through an altered epigenetic state. We aimed to investigate the impact of smoking on lung cells collected from bronchoalveolar lavage (BAL).
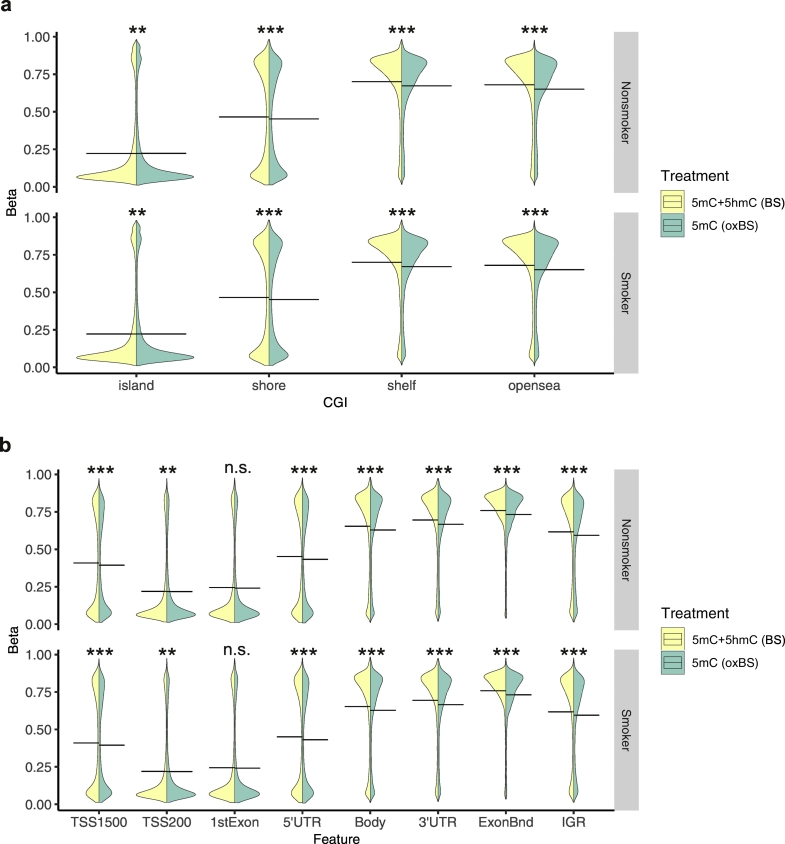
Methods: We profiled changes in DNA methylation (5mC) and its oxidised form hydroxymethylation (5hmC) using conventional bisulphite (BS) treatment and oxidative bisulphite treatment with Illumina Infinium MethylationEPIC BeadChip, and examined gene expression by RNA-seq in healthy smokers.
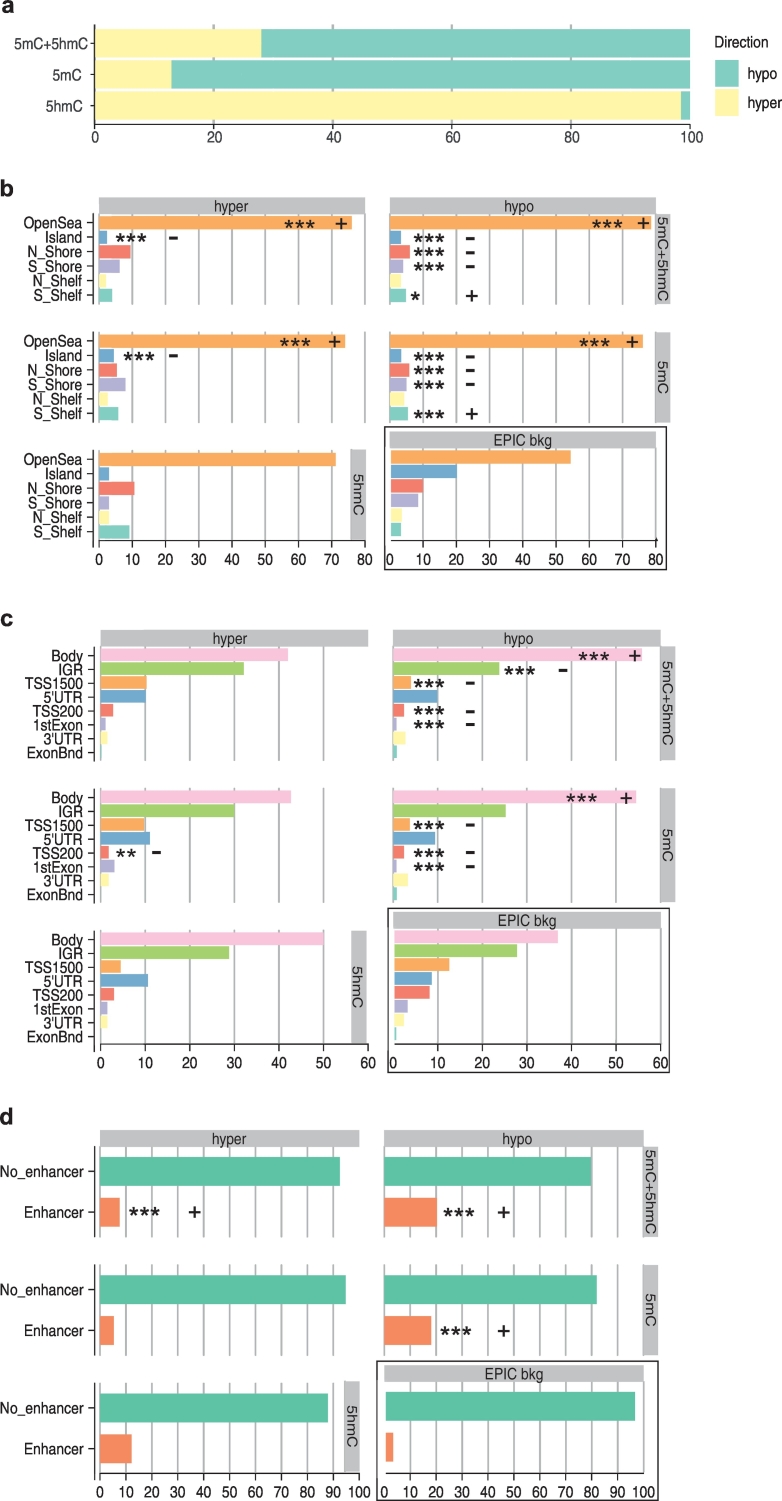
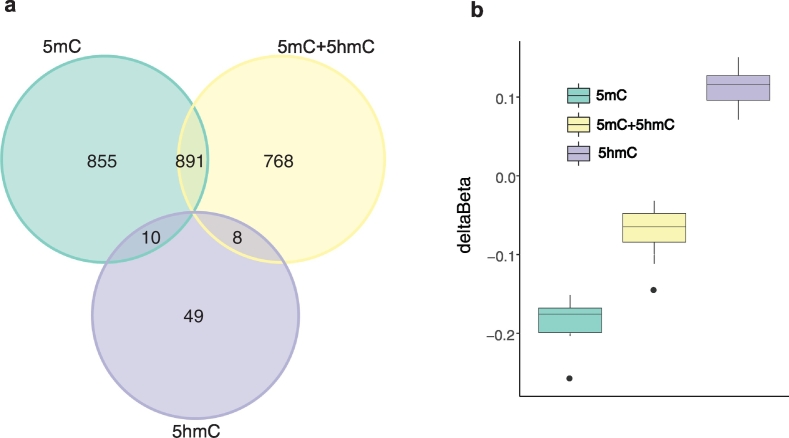
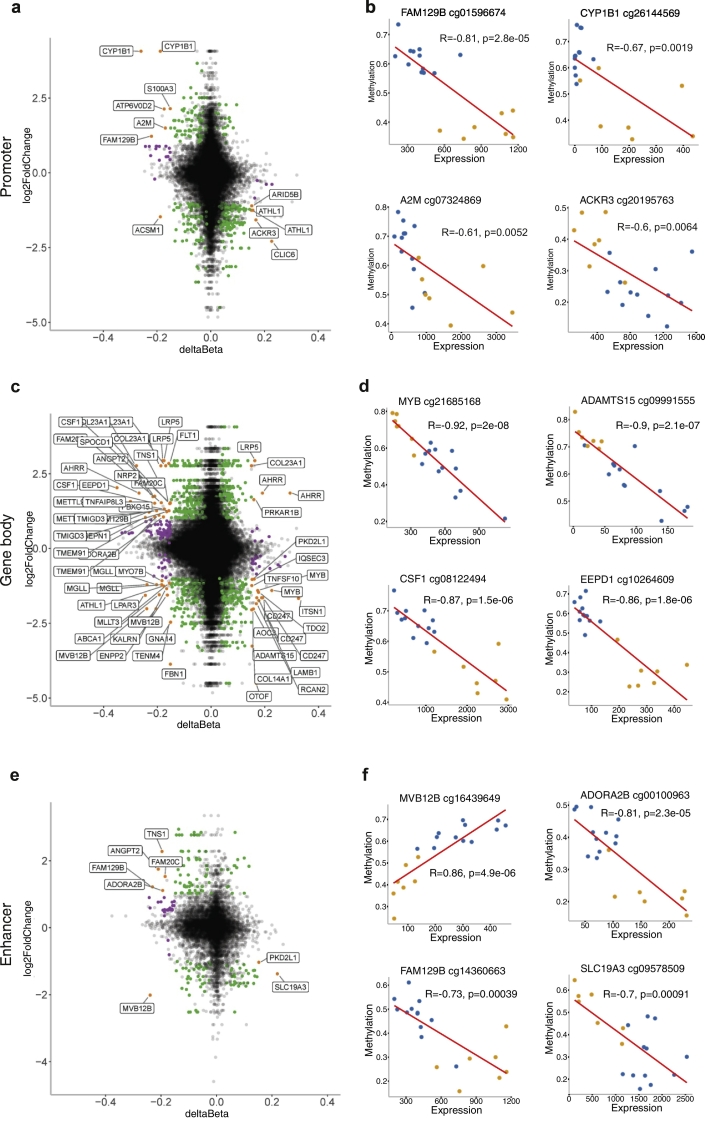
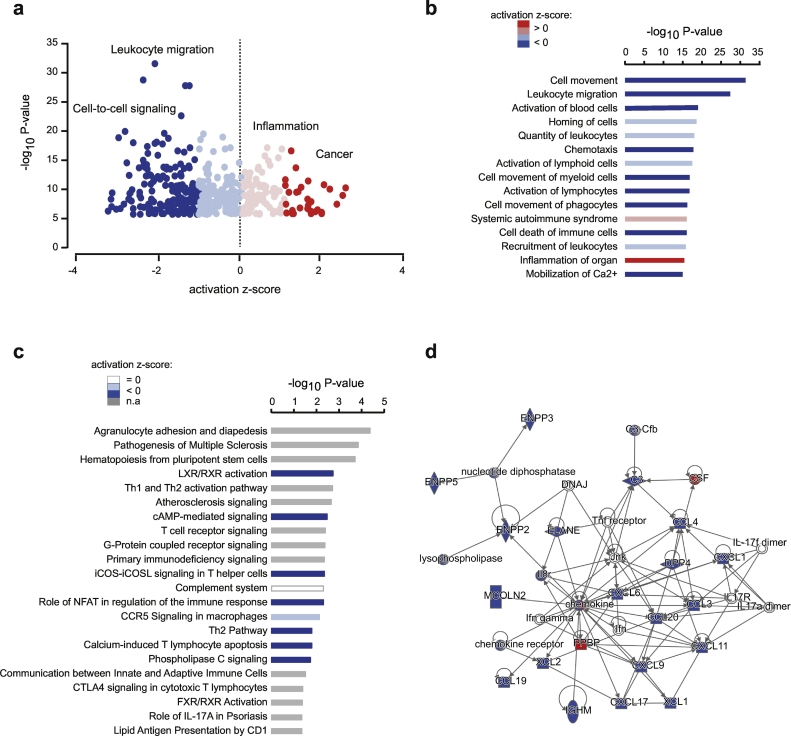
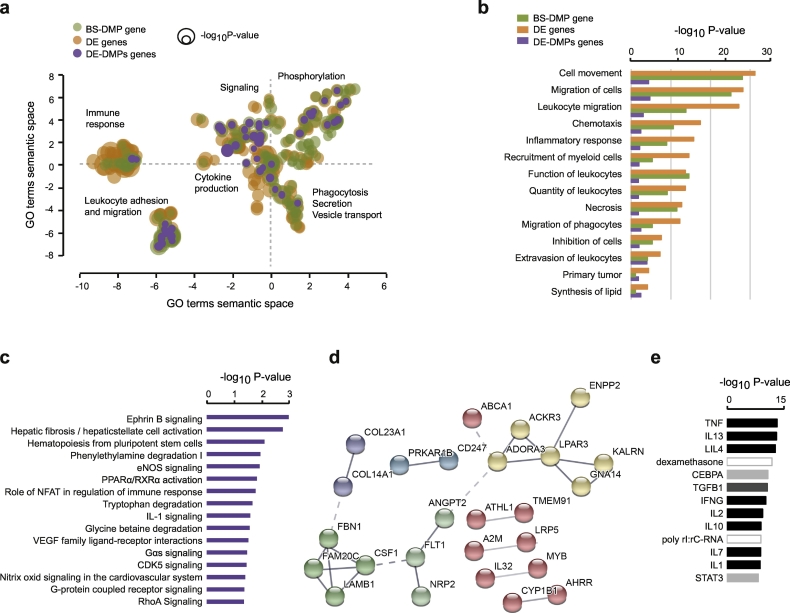
Findings: We identified 1667 total 5mC + 5hmC, 1756 5mC and 67 5hmC differentially methylated positions (DMPs) between smokers and non-smokers (FDR-adjusted P <.05, absolute Δβ >0.15). Both 5mC DMPs and to a lesser extent 5mC + 5hmC were predominantly hypomethylated. In contrast, almost all 5hmC DMPs were hypermethylated, supporting the hypothesis that smoking-associated oxidative stress can lead to DNA demethylation, via the established sequential oxidation of which 5hmC is the first step. While we confirmed differential methylation of previously reported smoking-associated 5mC + 5hmC CpGs using former generations of BeadChips in alveolar macrophages, the large majority of identified DMPs, 5mC + 5hmC (1639/1667), 5mC (1738/1756), and 5hmC (67/67), have not been previously reported. Most of these novel smoking-associating sites are specific to the EPIC BeadChip and, interestingly, many of them are associated to FANTOM5 enhancers. Transcriptional changes affecting 633 transcripts were consistent with DNA methylation profiles and converged to alteration of genes involved in migration, signalling and inflammatory response of immune cells.
Interpretation: Collectively, these findings suggest that tobacco smoke exposure epigenetically modifies BAL cells, possibly involving a continuous active demethylation and subsequent increased activity of inflammatory processes in the lungs. FUND: The study was supported by the Swedish Research Council, the Swedish Heart-Lung Foundation, the Stockholm County Council (ALF), the King Gustav's and Queen Victoria's Freemasons' Foundation, Knut and Alice Wallenberg Foundation, Neuro Sweden, and the Swedish MS foundation.
Keywords: Alveolar macrophages; DNA hydroxymethylation; DNA methylation; EPIC; Enhancers; Epigenetics; Oxidative stress; Smoking.
Copyright © 2019. Published by Elsevier B.V.
Conflict of interest statement
The authors declare that they have no competing interests.
Figures
Similar articles
-
Smoking-Induced DNA Hydroxymethylation Signature Is Less Pronounced than True DNA Methylation: The Population-Based KORA Fit Cohort.Biomolecules. 2024 Jun 5;14(6):662. doi: 10.3390/biom14060662. Biomolecules. 2024. PMID: 38927065 Free PMC article.
-
Epigenomic analysis of 5-hydroxymethylcytosine (5hmC) reveals novel DNA methylation markers for lung cancers.Neoplasia. 2020 Mar;22(3):154-161. doi: 10.1016/j.neo.2020.01.001. Epub 2020 Feb 12. Neoplasia. 2020. PMID: 32062069 Free PMC article.
-
Reciprocal changes in DNA methylation and hydroxymethylation and a broad repressive epigenetic switch characterize FMR1 transcriptional silencing in fragile X syndrome.Clin Epigenetics. 2016 Feb 5;8:15. doi: 10.1186/s13148-016-0181-x. eCollection 2016. Clin Epigenetics. 2016. PMID: 26855684 Free PMC article.
-
Environmental Epigenetics and Genome Flexibility: Focus on 5-Hydroxymethylcytosine.Int J Mol Sci. 2020 May 2;21(9):3223. doi: 10.3390/ijms21093223. Int J Mol Sci. 2020. PMID: 32370155 Free PMC article. Review.
-
DNA Methylation and Hydroxymethylation and Behavior.Curr Top Behav Neurosci. 2019;42:51-82. doi: 10.1007/7854_2019_104. Curr Top Behav Neurosci. 2019. PMID: 31392630 Review.
Cited by
-
Epigenome-450K-wide methylation signatures of active cigarette smoking: The Young Finns Study.Biosci Rep. 2020 Jul 31;40(7):BSR20200596. doi: 10.1042/BSR20200596. Biosci Rep. 2020. PMID: 32583859 Free PMC article.
-
Chronic Obstructive Pulmonary Disease Is Associated with Epigenome-Wide Differential Methylation in BAL Lung Cells.Am J Respir Cell Mol Biol. 2022 Jun;66(6):638-647. doi: 10.1165/rcmb.2021-0403OC. Am J Respir Cell Mol Biol. 2022. PMID: 35286818 Free PMC article.
-
Navigating the hydroxymethylome: experimental biases and quality control tools for the tandem bisulfite and oxidative bisulfite Illumina microarrays.Epigenomics. 2022 Feb;14(3):139-152. doi: 10.2217/epi-2021-0490. Epub 2022 Jan 14. Epigenomics. 2022. PMID: 35029129 Free PMC article.
-
Cytotoxic and Genotoxic Effects of Waterpipe on Oral Health Status: Systematic review and meta-analysis.Sultan Qaboos Univ Med J. 2023 Feb;23(1):5-12. doi: 10.18295/squmj.6.2022.043. Epub 2023 Feb 23. Sultan Qaboos Univ Med J. 2023. PMID: 36865434 Free PMC article.
-
Systemic Inflammatory Response and Outcomes in Community-Acquired Pneumonia Patients Categorized According to the Smoking Habit or Presence of Chronic Obstructive Pulmonary Disease.J Clin Med. 2020 Sep 7;9(9):2884. doi: 10.3390/jcm9092884. J Clin Med. 2020. PMID: 32906593 Free PMC article.
References
-
- Ezzati M., Lopez A.D. Estimates of global mortality attributable to smoking in 2000. Lancet. 2003;362(9387):847–852. - PubMed
-
- Hedstrom A.K., Sundqvist E., Baarnhielm M., Nordin N., Hillert J., Kockum I. Smoking and two human leukocyte antigen genes interact to increase the risk for multiple sclerosis. Brain. 2011;134:653–664. Pt 3. - PubMed
-
- Rodgman A., Perfetti T.A. 2nd Edition ed. CRC Press; Boca Raton: 2013. The chemical components of tobacco and tobacco smoke.
-
- Hussell T., Bell T.J. Alveolar macrophages: plasticity in a tissue-specific context. Nat. Rev. Immunol. 2014;14(2):81–93. - PubMed
MeSH terms
Grants and funding
LinkOut - more resources
Full Text Sources
Medical
Molecular Biology Databases
