

Functional secretome analysis reveals Annexin-A1 as important paracrine factor derived from fetal mesenchymal stem cells in hepatic regeneration
- PMID: 31303498
- PMCID: PMC6642415
- DOI: 10.1016/j.ebiom.2019.07.009
Functional secretome analysis reveals Annexin-A1 as important paracrine factor derived from fetal mesenchymal stem cells in hepatic regeneration
Abstract
Background: Human mesenchymal stem/stromal cells (MSCs) and their secreted molecules exert beneficial effects in injured tissues by promoting tissue regeneration and angiogenesis and by inhibiting inflammation and fibrosis. We have previously demonstrated that the therapeutic activity of fetal MSCs derived from amniotic fluid (AF-MSCs) and their hepatic progenitor-like cells (HPL) is mediated by paracrine effects in a mouse model of acute hepatic failure (AHF).
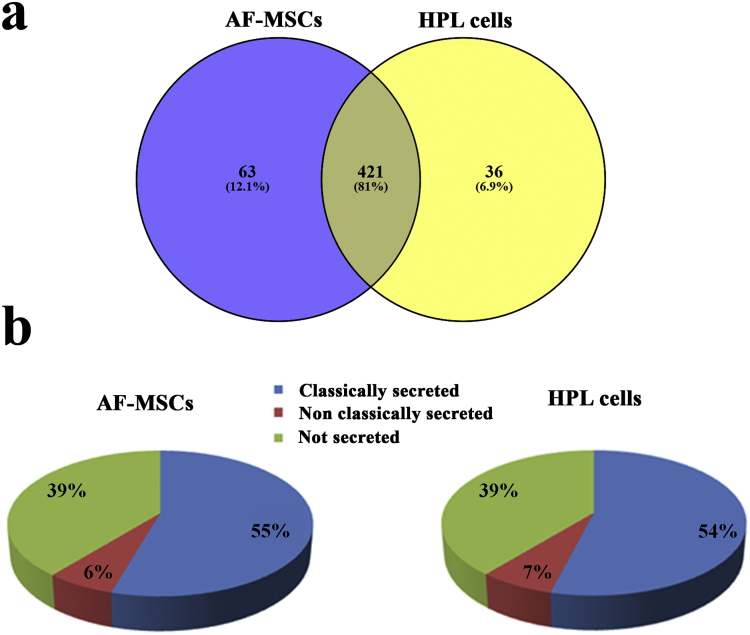
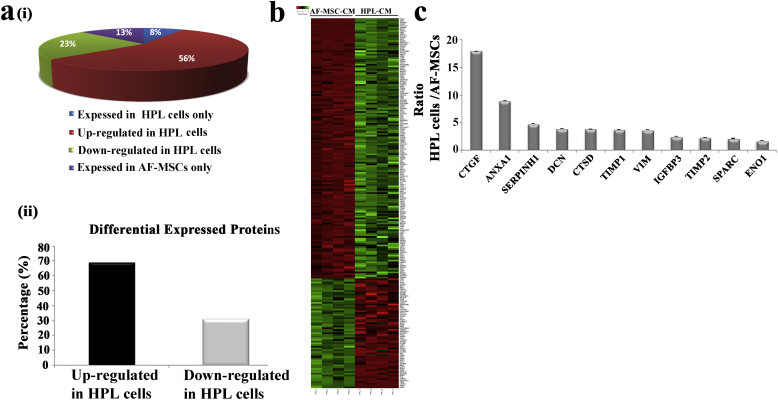
Methods: Herein, we have combined proteomic profiling of the AF-MSCs and HPL cell secretome with ex vivo and in vivo functional studies to identify specific soluble factors, which underpin tissue regeneration in AHF.
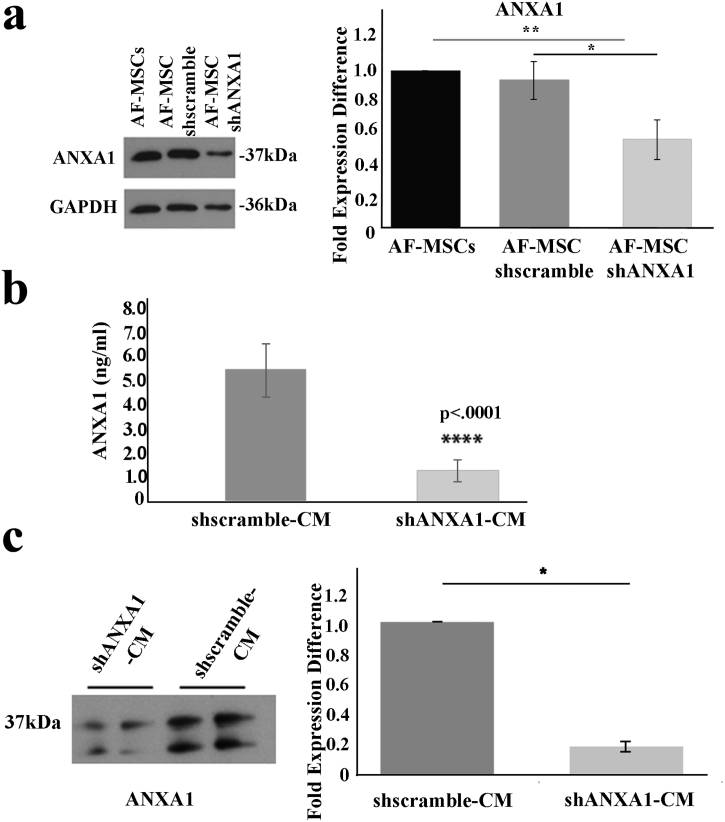
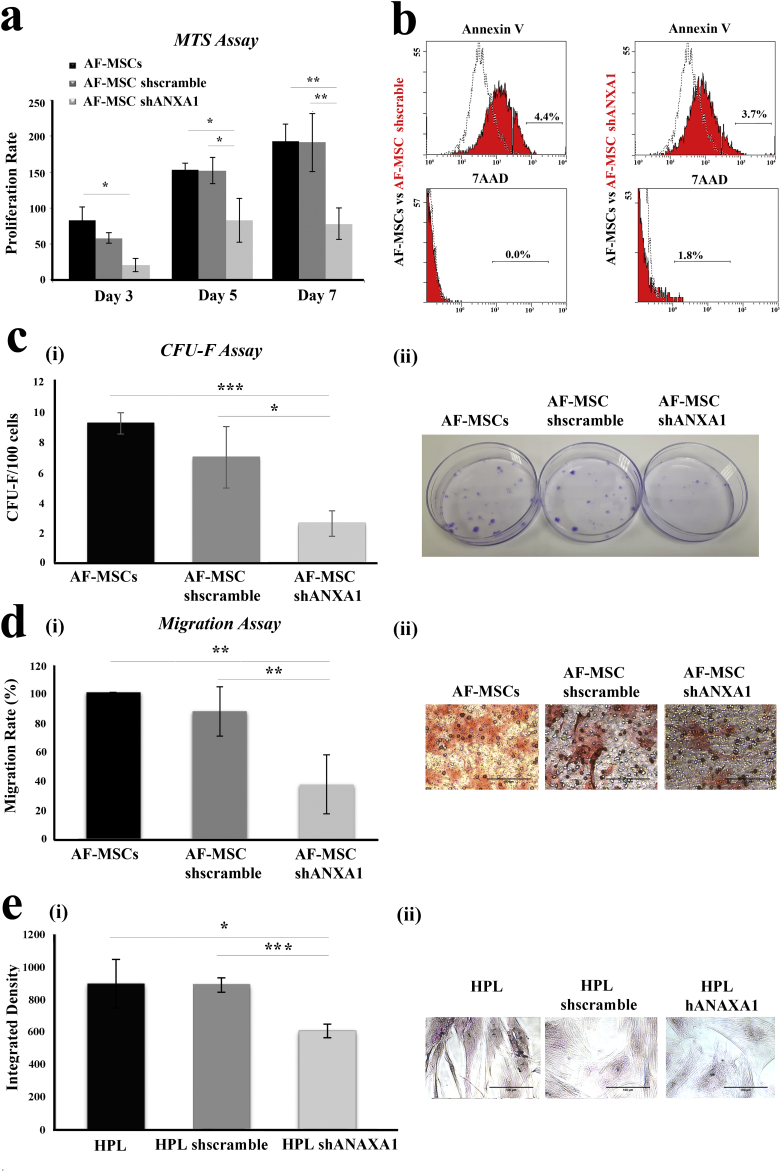
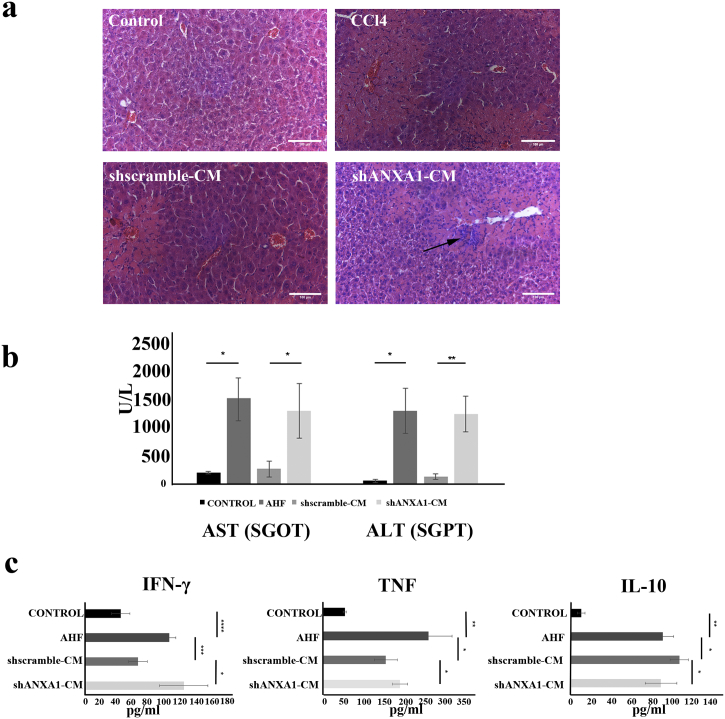
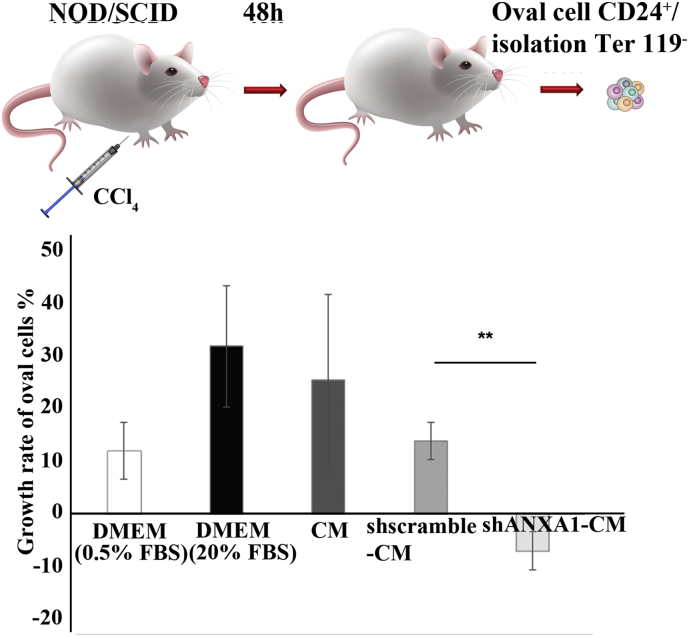
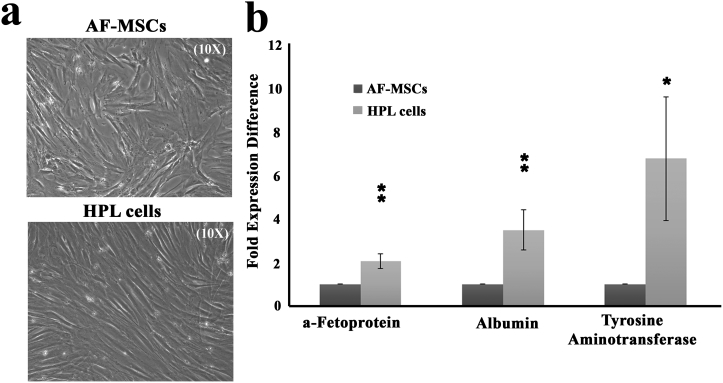
Findings: The anti-inflammatory molecule Annexin-A1 (ANXA1) was detected at high levels in both AF-MSC and HPL cell secretome. Further functional analyses revealed that the shRNA-mediated knock-down of ANXA1 in MSCs (shANXA1-MSCs) decreased their proliferative, clonogenic and migratory potential, as well as their ability to differentiate into HPL cells. Liver progenitors (oval cells) from AHF mice displayed reduced proliferation when cultured ex vivo in the presence of conditioned media from shANXA1-MSCs compared to control MSCs secretome. Intra-hepatic delivery of conditioned media from control MSCs but not shANXA1-MSCs reduced liver damage and circulating levels of pro-inflammatory cytokines in AHF.
Interpretation: Collectively, our study uncovers secreted Annexin-A1 as a novel effector of MSCs in liver regeneration and further underscores the potential of cell-free therapeutic strategies for liver diseases. FUND: Fondation Santé, GILEAD Asklipeios Grant, Fellowships of Excellence - Siemens, IKY, Reinforcement of Postdoctoral Researchers, IKY.
Keywords: Acute hepatic failure; Annexin-A1; Hepatic progenitors; MSCs; Secretome.
Copyright © 2019 The Authors. Published by Elsevier B.V. All rights reserved.
Figures
Similar articles
-
Therapeutic potential of a distinct population of human amniotic fluid mesenchymal stem cells and their secreted molecules in mice with acute hepatic failure.Gut. 2012 Jun;61(6):894-906. doi: 10.1136/gutjnl-2011-300908. Epub 2011 Oct 13. Gut. 2012. PMID: 21997562
-
Annexin A1 Is a Key Modulator of Mesenchymal Stromal Cell-Mediated Improvements in Islet Function.Diabetes. 2016 Jan;65(1):129-39. doi: 10.2337/db15-0990. Epub 2015 Oct 15. Diabetes. 2016. PMID: 26470781
-
Effect of Secreted Molecules of Human Embryonic Stem Cell-Derived Mesenchymal Stem Cells on Acute Hepatic Failure Model.Stem Cells Dev. 2016 Dec 15;25(24):1898-1908. doi: 10.1089/scd.2016.0244. Epub 2016 Oct 27. Stem Cells Dev. 2016. PMID: 27676103 Free PMC article.
-
Stem cells: insights into the secretome.Biochim Biophys Acta. 2013 Nov;1834(11):2380-4. doi: 10.1016/j.bbapap.2013.01.032. Epub 2013 Jan 31. Biochim Biophys Acta. 2013. PMID: 23376432 Review.
-
Proteomic techniques for characterisation of mesenchymal stem cell secretome.Biochimie. 2013 Dec;95(12):2196-211. doi: 10.1016/j.biochi.2013.07.015. Epub 2013 Jul 20. Biochimie. 2013. PMID: 23880644 Review.
Cited by
-
Therapeutic potential for targeting Annexin A1 in fibrotic diseases.Genes Dis. 2022 Jun 18;9(6):1493-1505. doi: 10.1016/j.gendis.2022.05.038. eCollection 2022 Nov. Genes Dis. 2022. PMID: 36157506 Free PMC article. Review.
-
MFGE-8 identified in fetal mesenchymal-stromal-cell-derived exosomes ameliorates acute hepatic failure pathology.iScience. 2023 Sep 30;26(11):108100. doi: 10.1016/j.isci.2023.108100. eCollection 2023 Nov 17. iScience. 2023. PMID: 37915594 Free PMC article.
-
Mesenchymal stem cell secretome for regenerative medicine: Where do we stand?J Adv Res. 2025 Apr;70:103-124. doi: 10.1016/j.jare.2024.05.004. Epub 2024 May 9. J Adv Res. 2025. PMID: 38729561 Free PMC article. Review.
-
Anti-inflammatory protein TSG-6 secreted by bone marrow mesenchymal stem cells attenuates neuropathic pain by inhibiting the TLR2/MyD88/NF-κB signaling pathway in spinal microglia.J Neuroinflammation. 2020 May 11;17(1):154. doi: 10.1186/s12974-020-1731-x. J Neuroinflammation. 2020. PMID: 32393298 Free PMC article.
-
Review on Current Advancements in Facilitation of Burn Wound Healing.Bioengineering (Basel). 2025 Apr 18;12(4):428. doi: 10.3390/bioengineering12040428. Bioengineering (Basel). 2025. PMID: 40281787 Free PMC article. Review.
References
-
- Prockop D.J. Marrow stromal cells as stem cells for continual renewal of nonhematopoietic tissues and as potential vectors for gene therapy. J Cell Biochem. 1998;(30−31):284–285. - PubMed
MeSH terms
Substances
LinkOut - more resources
Full Text Sources
Research Materials
Miscellaneous
