. 2019 Sep 5;25(3):373-387.e9.
doi: 10.1016/j.stem.2019.06.009. Epub 2019 Jul 11.

Generation of Human PSC-Derived Kidney Organoids with Patterned Nephron Segments and a De Novo Vascular Network

Affiliations

Generation of Human PSC-Derived Kidney Organoids with Patterned Nephron Segments and a De Novo Vascular Network

Jian Hui Low et al. Cell Stem Cell. .

Abstract

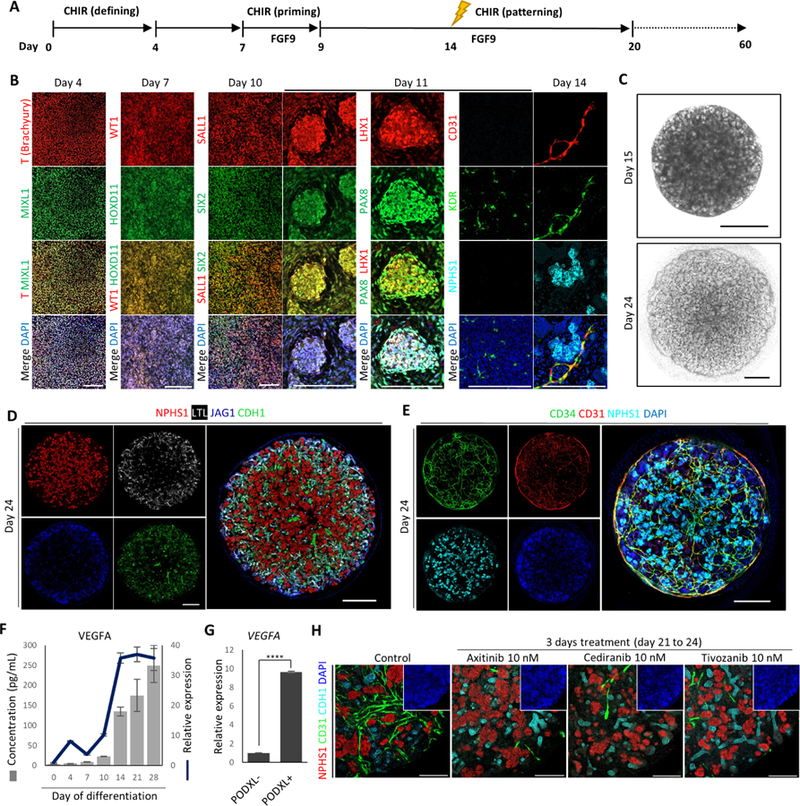
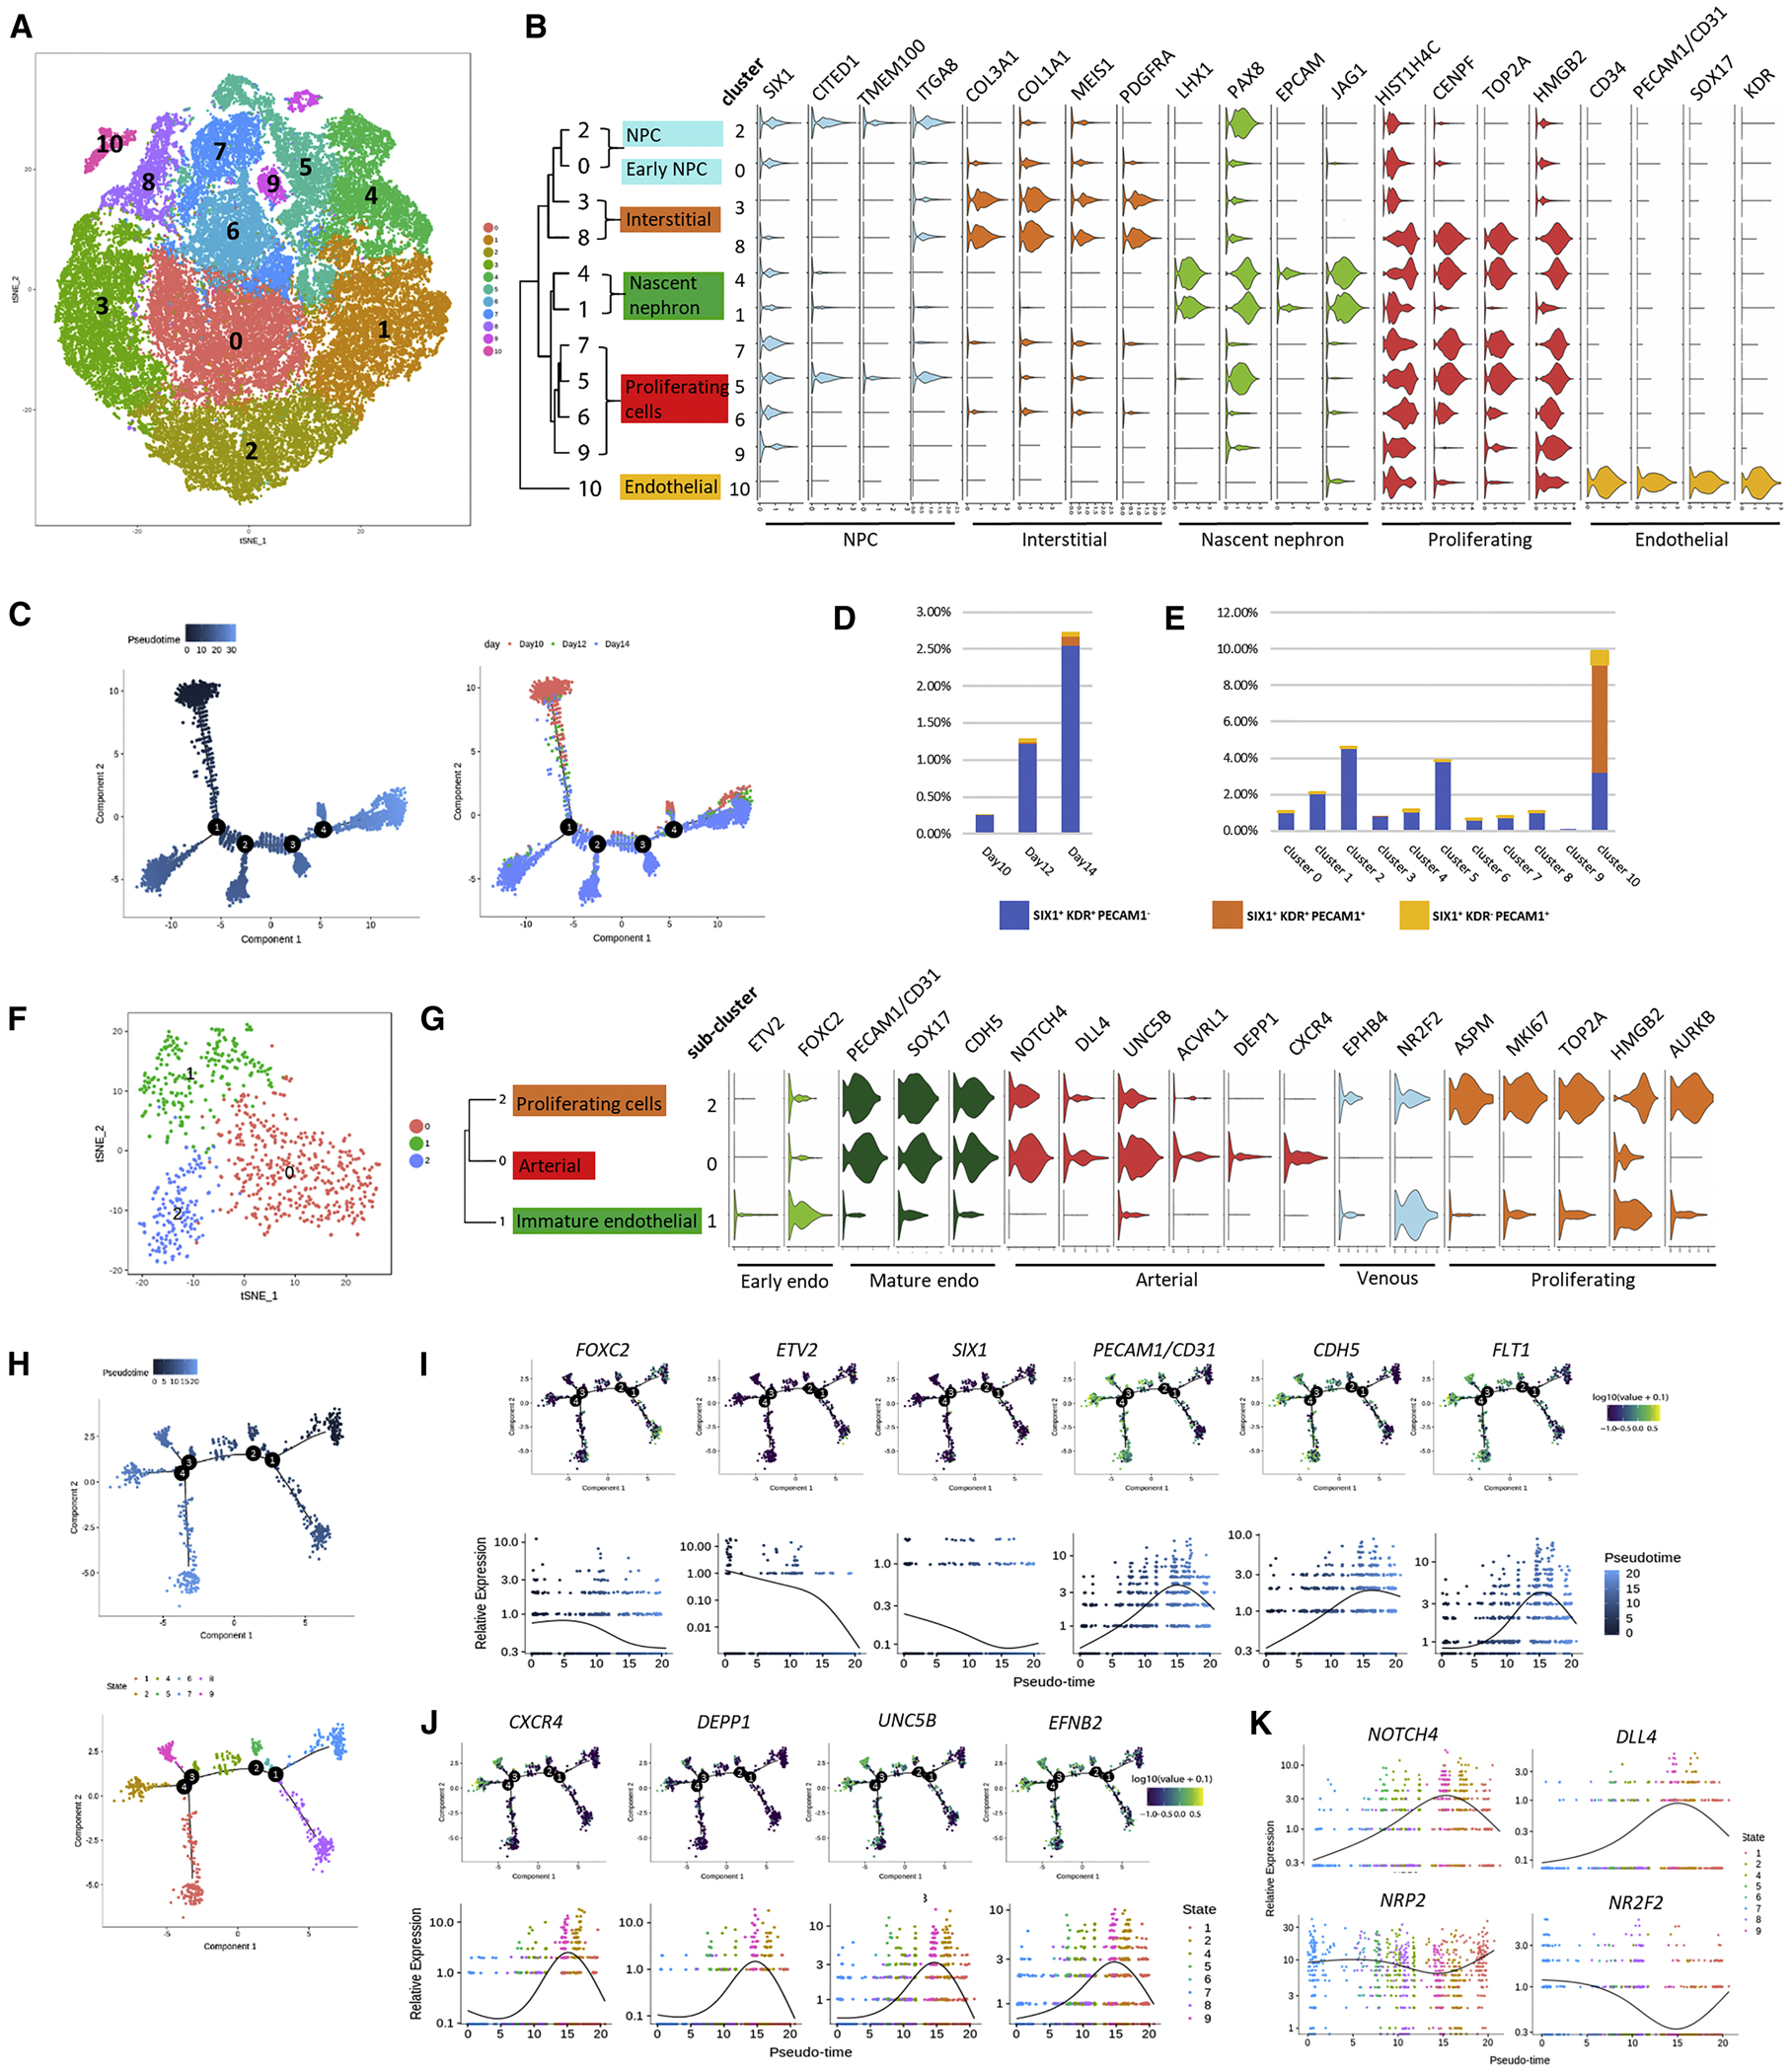
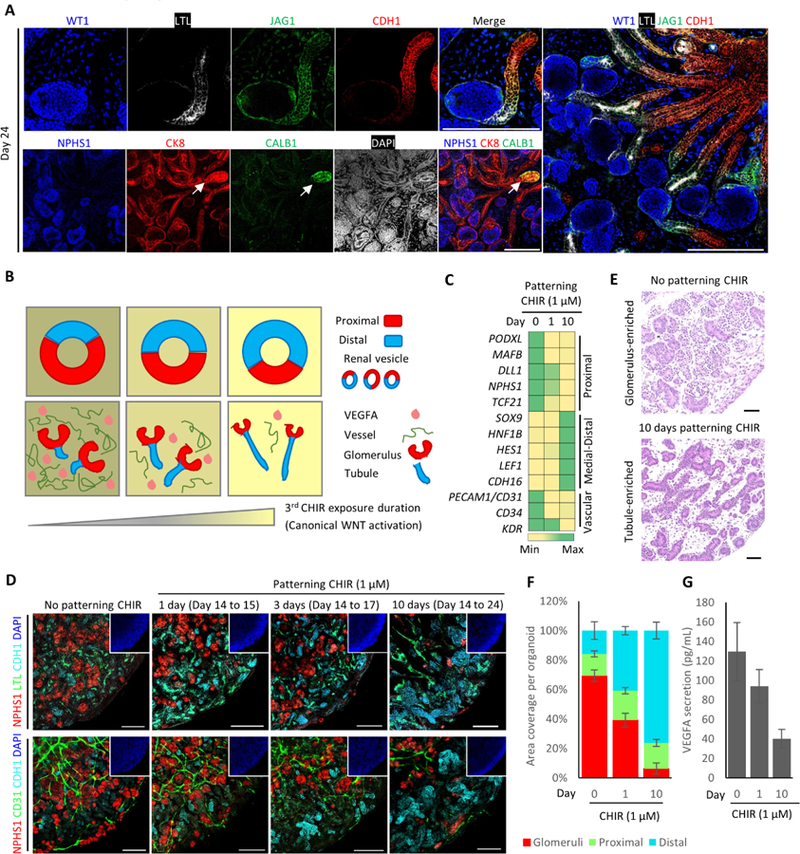
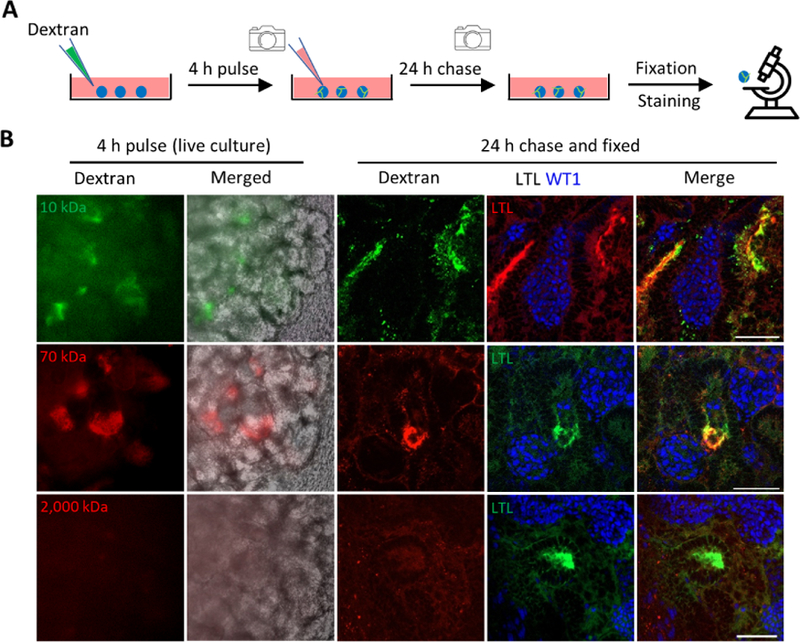
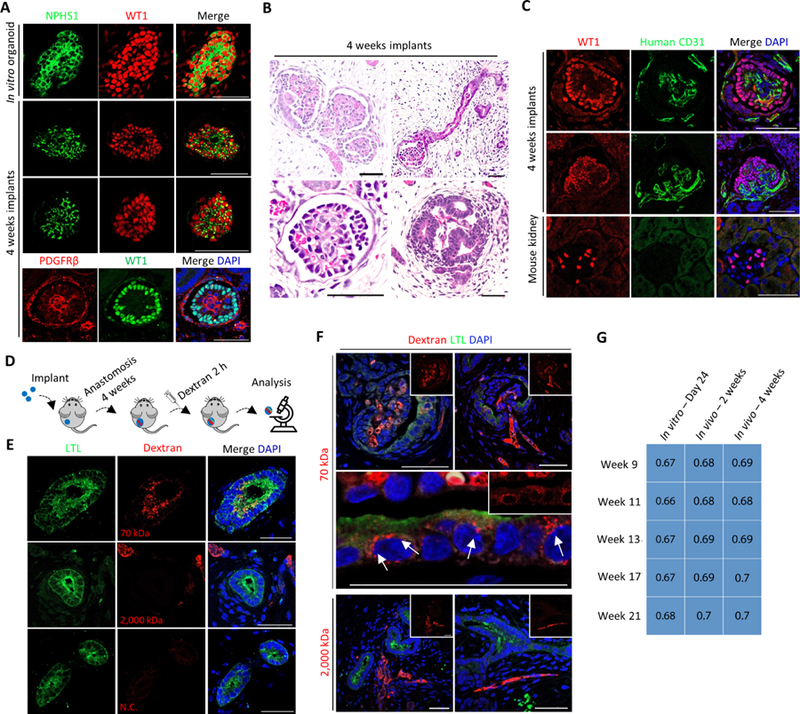
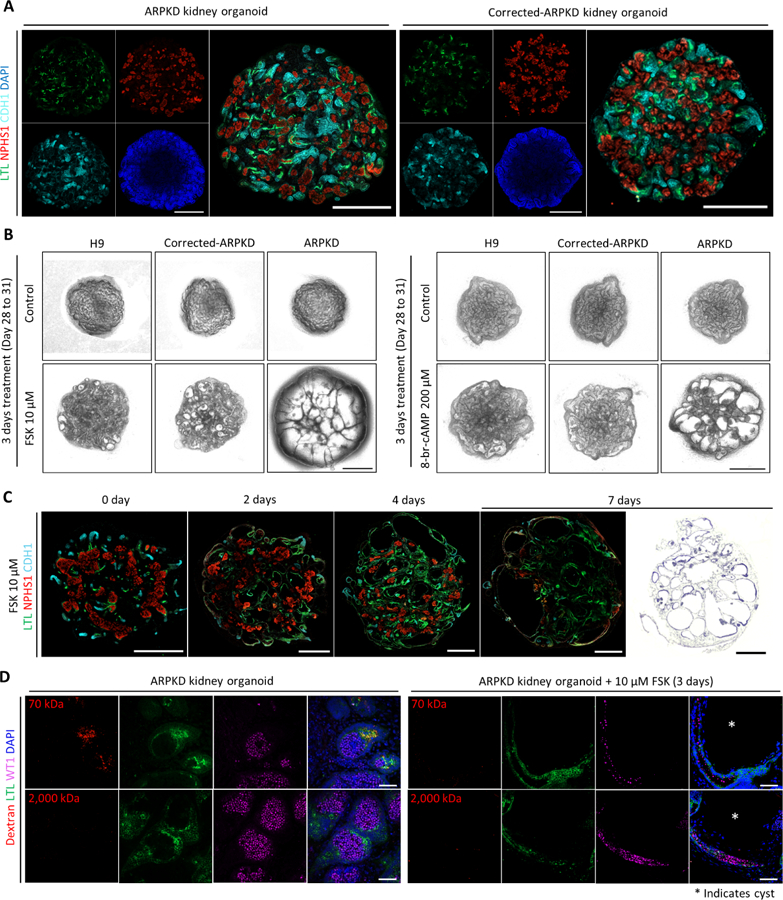
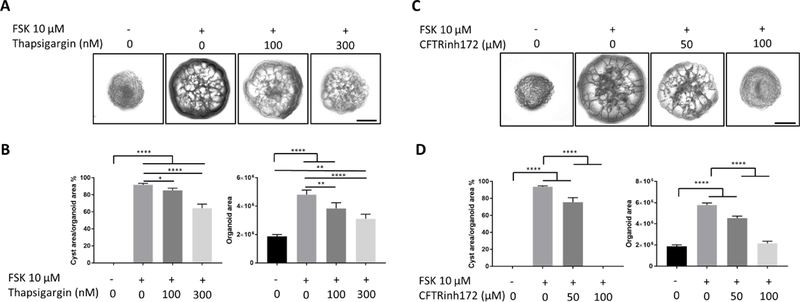
Human pluripotent stem cell-derived kidney organoids recapitulate developmental processes and tissue architecture, but intrinsic limitations, such as lack of vasculature and functionality, have greatly hampered their application. Here we establish a versatile protocol for generating vascularized three-dimensional (3D) kidney organoids. We employ dynamic modulation of WNT signaling to control the relative proportion of proximal versus distal nephron segments, producing a correlative level of vascular endothelial growth factor A (VEGFA) to define a resident vascular network. Single-cell RNA sequencing identifies a subset of nephron progenitor cells as a potential source of renal vasculature. These kidney organoids undergo further structural and functional maturation upon implantation. Using this kidney organoid platform, we establish an in vitro model of autosomal recessive polycystic kidney disease (ARPKD), the cystic phenotype of which can be effectively prevented by gene correction or drug treatment. Our studies provide new avenues for studying human kidney development, modeling disease pathogenesis, and performing patient-specific drug validation.

Keywords: ARPKD; developmental modeling; disease modeling; implantation; kidney organoid; nephron patterning; patient-specific iPSC; pluripotent stem cells; single-cell RNA-seq; vascular progenitors.


Conflict of interest statement

DECLARATION OF INTERESTS

The authors declare no competing interests.

Figures

Figure 1
Figure 1. Differentiation of hPSCs into Vascularized 3D Kidney Organoids
(A) Schematic of differentiation protocol. (B) Immunofluorescence analysis for markers of primitive streak (T, MIXL1), intermediate mesoderm (WT1, HOXD11), nephron progenitor (SALL1, SIX2), pre-tubular aggregate (LHX1, PAX8), podocyte (NPHS1), vascular progenitor (KDR), and endothelial cell (CD31) during differentiation. Scale bars, 200 μm. (C) Representative bright-field images of 3D kidney organoids (upper panel: Day 15 kidney organoid in liquid culture; lower panel: Day 24 kidney organoid in liquid-air interface culture.). Scale bars, 200 μm. (D and E) Whole-mount immunofluorescence analysis of 3D kidney organoids (Day 24). (F)Time course analysis of VEGFA gene expression (line) and VEGFA protein secretion (bars) during differentiation. Data were represented as mean ± SEM (n = 2 independent experiments, with 3 technical replicates). (G) Comparison of VEGFA gene expression levels in PODXL and PODXL+ cells of kidney organoids (Day 24). Data were represented as mean ± SEM (n = 2 independent experiments with 3 technical replicates). Statistical analysis was performed using unpaired Student’s t-test, **** p < 0.0001. (H) Whole-mount immunofluorescence analysis of 3D kidney organoids (Day 24) treated with VEGFR inhibitors for 3 days. Scale bars, 200 μm.
Figure 2
Figure 2. Single-Cell Transcriptomics Analysis of Early Nephrogenesis
(A) tSNE plot displaying 62,506 cells from day 10, 12, and 14 of differentiation. Unsupervised clustering identified 11 clusters that are marked by different colors. (B) Violin plots showing expression of representative marker genes. (C) Ordering of the entire pooled scRNA-seq expression data according to pseudotime position. (D and E) Dynamic distribution of cells that express different combinations of SIX1, KDR, and PECAM1/CD31, per differentiation time point (D), or per cluster (E). (F) tSNE plot of cells within the endothelial sub-cluster from (A). Unsupervised clustering identified 3 sub-clusters that are marked by different colors. (G) Violin plots showing expression of representative marker genes within the endothelial sub-cluster. (H) Lineage trajectory of the endothelial sub-cluster, by pseudotime (upper panel), or by cell state (lower panel). (I) Expression levels of early hemangioblast markers (FOXC2, ETV2, SIX1) and more mature endothelial markers (PECAM1/CD31, CDH5, FLT1) along endothelial lineage trajectory. (J) Expression levels of arterial markers along endothelial lineage trajectory. (K) Divergent trend of arterial (NOTCH4, DLL4) and venous (NRP2, NR2F2) marker expression along endothelial lineage trajectory.
Figure 3
Figure 3. Modulating the Proportion of Proximal-versus-Distal Segments and the Vascular Network within 3D Kidney Organoids
(A) Whole-mount immunofluorescence analysis of nephron segment-specific markers in 3D kidney organoids (Day 24). Scale bars, 200 μm. (B) Proposed model for in vitro kidney organoid patterning (modified from Lindstrom et al., 2015 and GUDMAP). (C) Gene expression profiling of 3D kidney organoids (Day 24) with different exposure lengths to patterning CHIR. Color shading correlates with the relative fold change in gene expression levels. Data were presented as mean ± SEM (n = 2 independent experiments with 3 technical replicates). (D) Whole-mount immunofluorescence analysis of 3D kidney organoids (Day 24) with different exposure lengths to patterning CHIR. Scale bars, 200 μm. (E) Representative H&E staining images of 3D kidney organoids (Day 24) in the absence or presence of patterning CHIR. Scale bars, 50 μm. (F) Quantification for the ratio of multiple nephron segments in 3D kidney organoids (Day 24) with different exposure lengths to patterning CHIR. Data were presented as mean ± SEM (n = 3 independent experiments). (G) VEGFA protein secretion by 3D kidney organoids (Day 24) with different exposure lengths to patterning CHIR. Data were presented as mean ± SEM (n = 3 independent experiments).
Figure 4
Figure 4. In Vitro Functional Validation of 3D Kidney Organoids
(A) Schematic of in vitro dextran uptake assay. (B) Left panels: live images of kidney organoids incubated with fluorescence-labeled dextran of various molecule weights. Right panels: whole-mount immunofluorescence analysis of kidney organoids following dextran update assay. Scale bars, 50 μm.
Figure 5
Figure 5. Structural and Functional Validation of Kidney Organoid Implants
(A) Immunofluorescence analysis of in vitro kidney organoids and 4 weeks kidney organoid implants. Scale bars, 50 μm. (B) Representative H&E staining images of kidney organoid implants (4 weeks). Scale bars, 50 μm. (C) Immunofluorescence analysis of kidney organoid implants (upper panels) and adult mouse kidney (lower panels). Scale bars, 50 μm. (D) Schematic of in vivo dextran uptake assay. (E and F) Immunofluorescence analysis of kidney organoid implants, the host mice of which were systemically injected with fluorescence-labeled dextran of various molecule weights, or with PBS. N.C. denotes PBS negative control. White arrow indicates putative endosome. Scale bars, 50 μm. (G) Transcriptome correlation plot of in vitro – Day 24, in vivo – 2 weeks, and in vivo – 4 weeks kidney organoids with human fetal kidneys at week 9, 11, 13, 17 and 21. Correlation coefficient indicated within squares. Significantly correlated features (p ≤ 0.05) were indicated by blue shading.
Figure 6
Figure 6. ARPKD Kidney Organoids Recapitulate Cystogenesis
(A) Whole-mount immunofluorescence analysis of 3D kidney organoids (Day 24) derived from ARPKD iPSCs and corrected-ARPKD iPSCs. Scale bars, 500 μm. (B) Representative bright-field images of 3D kidney organoids derived from H9 embryonic stem cells (ESCs), corrected-ARPKD iPSCs, and ARPKD iPSCs, in the absence or presence of forskolin (FSK)/8-br-cAMP for 3 days (Day 28 to 31). Scale bars, 500 μm. (C) Left panels: time course whole-mount immunofluorescence analysis of ARPKD kidney organoids treated with 10 μM FSK. Right most panel: representative H&E staining image of ARPKD kidney organoid treated with 10 μM FSK for 7 days (Day 28 to 35). Scale bars, 500 μm. (D) Immunofluorescence analysis of ARPKD kidney organoids in the absence or presence of 10 μM FSK for 3 days (Day 28 to 31) followed by in vitro dextran uptake assays. White asterisk indicates cyst. Scale bars, 50 μm.
Figure 7
Figure 7. Chemical Compounds Inhibit ARPKD Kidney Organoid Cystogenesis
(A)Representative bright-field images of ARPKD kidney organoids treated with various concentrations of Thapsigargin in the absence or presence of 10 μM FSK for 3 days (Day 28 to 31). Scale bars, 500 μm. (B) Statistical analysis of the effect of Thapsigargin on FSK-induced ARPKD kidney organoid cystogenesis. Data were presented as mean ± SEM (n = 3 independent experiments). Statistical analysis was performed using one-way ANOVA, * p < 0.05,** p < 0.01, **** p < 0.0001. (C) Representative bright-field images of ARPKD kidney organoids treated with various concentrations of CFTRinh172 in the absence or presence of 10 μM FSK for 3 days (Day 28 to 31). Scale bars, 500 μm. (D) Statistical analysis of the effect of CFTRinh172 on FSK-induced ARPKD kidney organoid cystogenesis. Data were presented as mean ± SEM (n = 3 independent experiments). Statistical analysis was performed using one-way ANOVA, **** p < 0.0001.

References

    1. ABRAHAMSON DR, ROBERT B, HYINK DP, ST JOHN PL & DANIEL TO 1998. Origins and formation of microvasculature in the developing kidney. Kidney Int Suppl, 67, S7–11. - PubMed
    1. BANTOUNAS I, RANJZAD P, TENGKU F, SILAJDZIC E, FORSTER D, ASSELIN MC, LEWIS P, LENNON R, PLAGGE A, WANG Q, WOOLF AS & KIMBER SJ 2018. Generation of Functioning Nephrons by Implanting Human Pluripotent Stem Cell-Derived Kidney Progenitors. Stem Cell Reports, 10, 766–779. - PMC - PubMed
    1. BARASCH J, YANG J, WARE CB, TAGA T, YOSHIDA K, ERDJUMENT-BROMAGE H, TEMPST P, PARRAVICINI E, MALACH S, ARANOFF T & OLIVER JA 1999. Mesenchymal to epithelial conversion in rat metanephros is induced by LIF. Cell, 99, 377–86. - PubMed
    1. BIRN H & CHRISTENSEN EI 2006. Renal albumin absorption in physiology and pathology. Kidney Int, 69, 440–9. - PubMed
    1. BRUNSKILL EW, GEORGAS K, RUMBALLE B, LITTLE MH & POTTER SS 2011. Defining the molecular character of the developing and adult kidney podocyte. PLoS One, 6, e24640. - PMC - PubMed

Publication types

MeSH terms

Substances