. 2019 Jul 3:12:175.
doi: 10.1186/s13068-019-1494-8. eCollection 2019.

Internalization and accumulation of model lignin breakdown products in bacteria and fungi

Affiliations

Internalization and accumulation of model lignin breakdown products in bacteria and fungi

Meghan C Barnhart-Dailey et al. Biotechnol Biofuels. .

Abstract

Background: Valorization of lignin has the potential to significantly improve the economics of lignocellulosic biorefineries. However, its complex structure makes conversion to useful products elusive. One promising approach is depolymerization of lignin and subsequent bioconversion of breakdown products into value-added compounds. Optimizing transport of these depolymerization products into one or more organism(s) for biological conversion is important to maximize carbon utilization and minimize toxicity. Current methods assess internalization of depolymerization products indirectly-for example, growth on, or toxicity of, a substrate. Furthermore, no method has been shown to provide visualization of depolymerization products in individual cells.

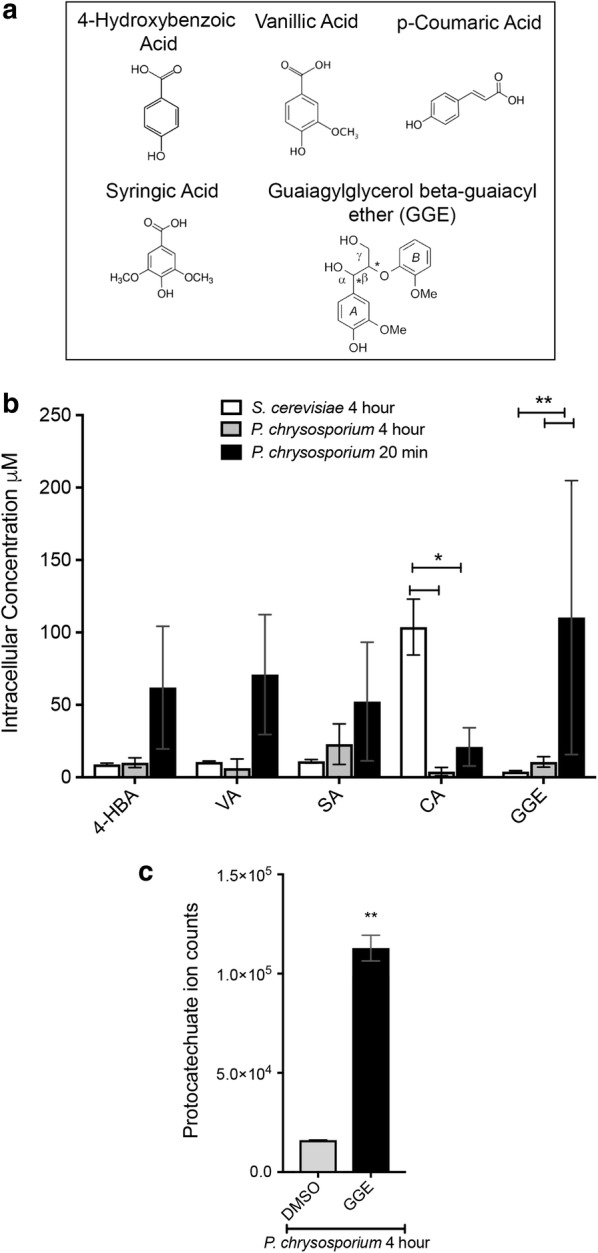
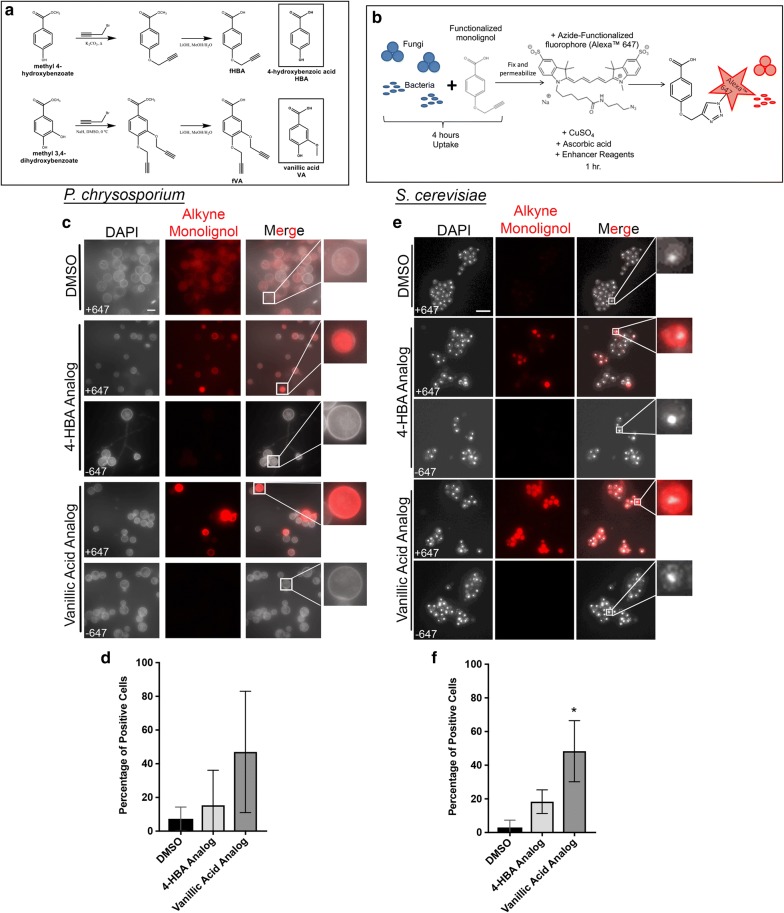
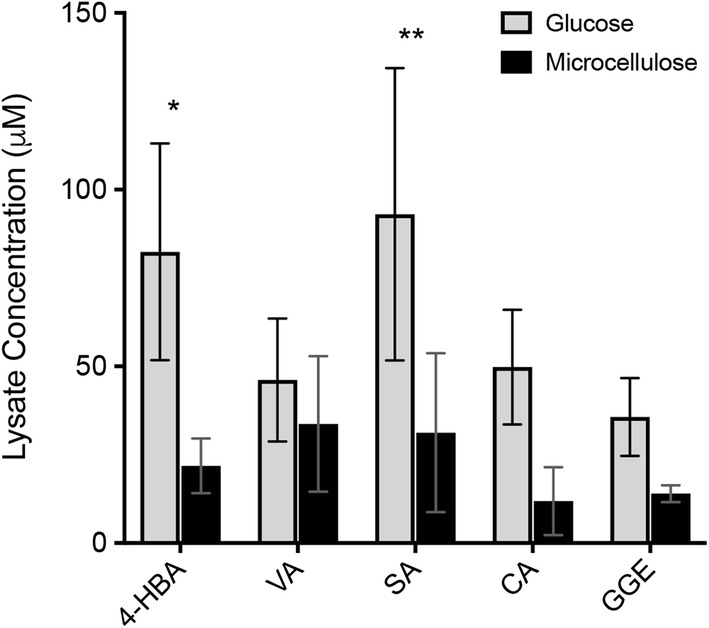
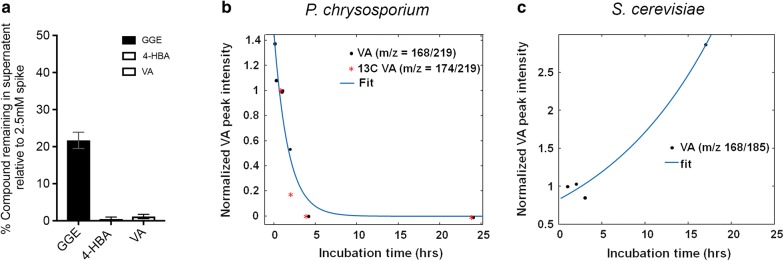
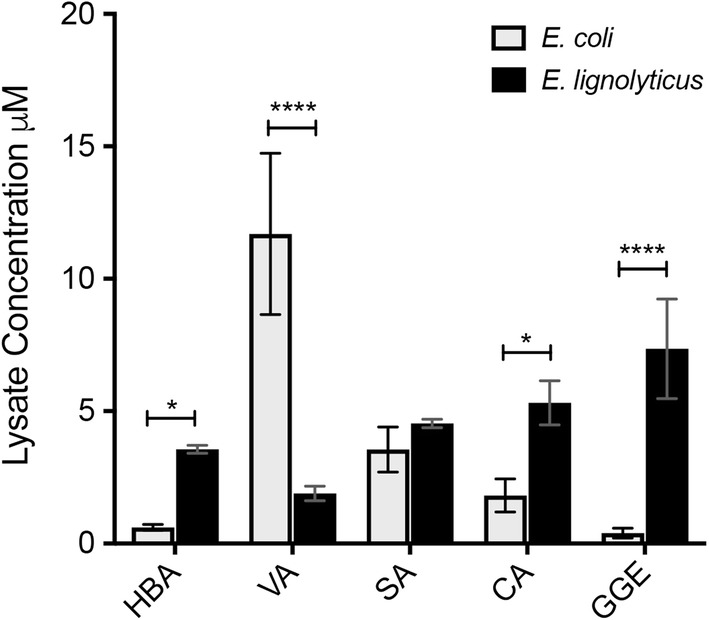
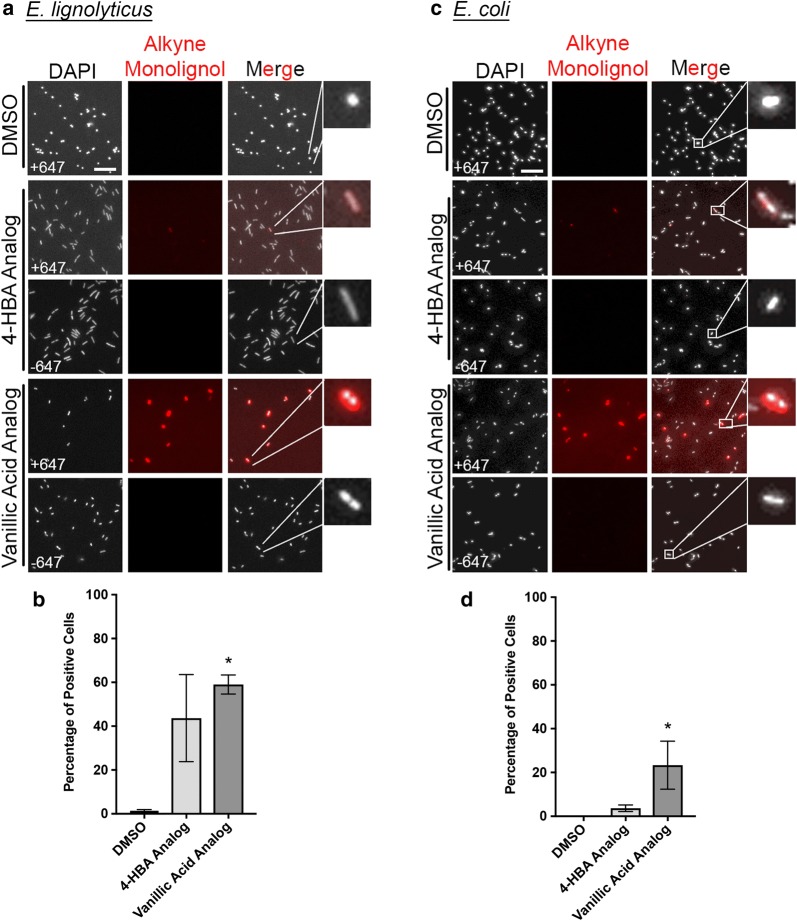
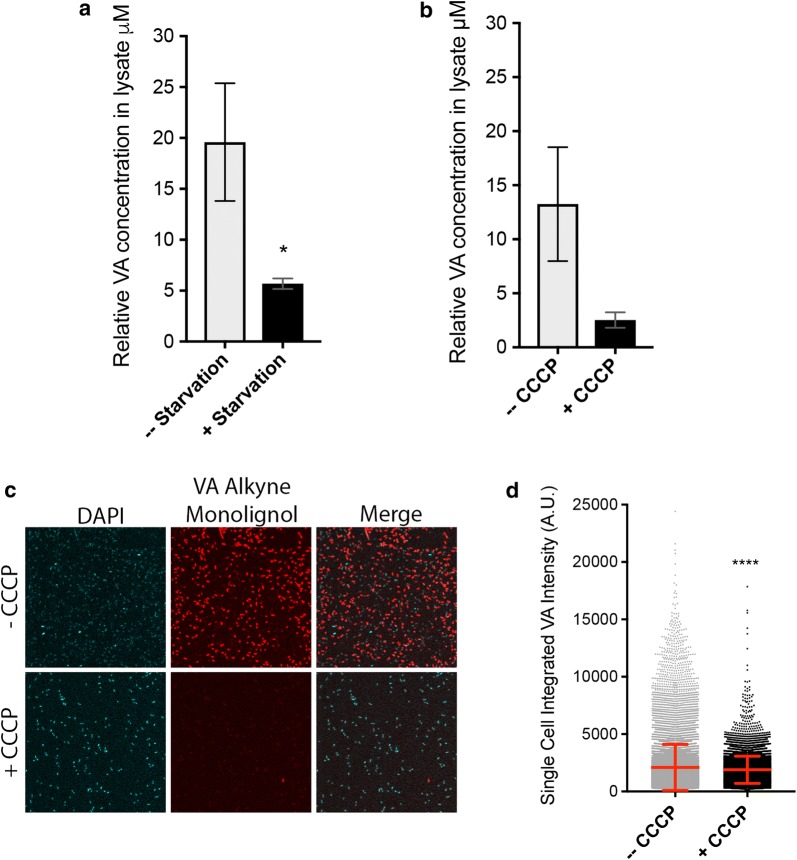
Results: We applied mass spectrometry to provide direct measurements of relative internalized concentrations of several lignin depolymerization compounds and single-cell microscopy methods to visualize cell-to-cell differences in internalized amounts of two lignin depolymerization compounds. We characterized internalization of 4-hydroxybenzoic acid, vanillic acid, p-coumaric acid, syringic acid, and the model dimer guaiacylglycerol-beta-guaiacyl ether (GGE) in the lignolytic organisms Phanerochaete chrysosporium and Enterobacter lignolyticus and in the non-lignolytic but genetically tractable organisms Saccharomyces cerevisiae and Escherichia coli. The results show varying degrees of internalization in all organisms for all the tested compounds, including the model dimer, GGE. Phanerochaete chrysosporium internalizes all compounds in non-lignolytic and lignolytic conditions at comparable levels, indicating that the transporters for these compounds are not specific to the lignolytic secondary metabolic system. Single-cell microscopy shows that internalization of vanillic acid and 4-hydroxybenzoic acid analogs varies greatly among individual fungal and bacterial cells in a given population. Glucose starvation and chemical inhibition of ATP hydrolysis during internalization significantly reduced the internalized amount of vanillic acid in bacteria.

Conclusions: Mass spectrometry and single-cell microscopy methods were developed to establish a toolset for providing direct measurement and visualization of relative internal concentrations of mono- and di-aryl compounds in microbes. Utilizing these methods, we observed broad variation in intracellular concentration between organisms and within populations and this may have important consequences for the efficiency and productivity of an industrial process for bioconversion. Subsequent application of this toolset will be useful in identifying and characterizing specific transporters for lignin-derived mono- and di-aryl compounds.

Keywords: Bioconversion; Di-aryl; Lignin; Mass spectrometry; Mono-aryl; Single-cell analysis; Transport.


Conflict of interest statement

Competing interestsThe authors declare that they have no competing interests.

Figures

Fig. 1
Fig. 1
Internalization of lignin fragments into lignolytic and non-lignolytic fungi. a Chemical structures of mono- and di-lignols tested in internalization assays. b Relative lysate concentrations (µM) obtained from QToF LC/MS analysis of mono- and di-lignols in S. cerevisiae (white bars) and P. chrysosporium cell lysates after 4 h (gray bars) or 20 min (black bars) of lignol internalization. Error bars show the standard deviation of three biological replicates. *Indicates p value of < 0.0461, **Indicates p value < 0.004 following two-way ANOVA analysis. c Average ion counts for protocatechuate (GGE metabolite) in P. chrysosporium cell lysates incubated with DMSO or GGE for 4 h. Error bars show standard deviation of two biological replicates. **p value 0.0022 by t test
Fig. 2
Fig. 2
Single-cell microscopy of lignin fragment internalization in fungi. a Chemical synthesis pathway of mono- and di-functionalized 4-HBA (fHBA) and vanillic acid (fVA), respectively. b Schematic of click chemistry-mediated fluorescent labeling of bacteria and fungi. Imaging samples were paired with LC/MS studies and done in biological triplicate. c Representative images of P. chrysosporium cells following 4 h of internalization with functionalized lignols, fixation, and AlexaFluor™ 647 labeling. d Quantification of experiment in c. e Representative images of S. cerevisiae cells following 4 h of internalization with functionalized lignols, fixation, and AlexaFluor™ 647 labeling. f Quantification of experiment in e. Error bars in d and f represent standard deviation of three biological replicates. *Indicates p value of 0.0146 by Kruskal–Wallis test. Scale bars in c and e represent 5 µm
Fig. 3
Fig. 3
Comparison of compound accumulation in lignolytic and non-lignolytic states of P. chrysosporium. Relative lysate concentrations (µM) obtained from QToF LC/MS analysis of mono- and di-lignols in lysates of P. chrysosporium grown in the presence of either glucose (non-lignolytic, gray bars) or microcellulose (lignolytic, black bars). 20-min time point is shown. Error bars represent the standard deviation of three biological replicates. *Indicates p value of 0.01, **Indicates p value 0.0085 following two-way ANOVA analysis
Fig. 4
Fig. 4
Evidence of lignin fragment catabolism in fungi. a HPLC results measuring the percentage of compounds remaining in PBS following 72 h of internalization by P. chrysosporium. Percentages were calculated using a 2.5 mM spiked sample. b ASAP-MS results of vanillic acid (m/z = 168.02) and 6C13 vanillic acid (m/z = 174.03) in P. chrysosporium lysate following a time course of internalization from 1 to 10 h. Vanillic acid and 6C13 vanillic acid were measured in separate biological replicates. No counts above background were detected at m/z = 168.02 and m/z = 174.03 in absence of addition of these compounds. c ASAP-MS results of vanillic acid peak intensity in S. cerevisiae following a time course of internalization from 1 to 17 h. A single biological replicate is shown for c
Fig. 5
Fig. 5
Internalization of lignin fragments into lignolytic and non-lignolytic bacteria. Relative lysate concentrations of mono- and di-lignols (µM) obtained from QToF LC/MS analysis of E. coli (gray bars) versus E. lignolyticus (black bars) lysates following 4 h of internalization. Error bars represent standard deviation of three biological replicates. *Indicates p value of < 0.0372, ****indicates p value < 0.0001 following two-way ANOVA analysis
Fig. 6
Fig. 6
Single-cell microscopy of lignin fragment internalization in bacteria. a Representative images of E. lignolyticus cells following 4 h of internalization with functionalized lignols, fixation, and AlexaFluor™ 647 labeling. b Quantification of experiment in a. c Representative images of E. coli cells following 4 h of internalization with functionalized lignols, fixation, and AlexaFluor™ 647 labeling. d Quantification of experiment in c. Scale bars in a and c represent 5 µm. Bars in b, d are the average of three biological replicates, and error bars represent standard deviation of these replicates. *Indicates p value of 0.0262 for b and 0.0127 for d by Kruskal–Wallis test
Fig. 7
Fig. 7
Lignin fragment internalization requires energy in bacteria. a TQD-MS results showing relative VA concentrations in E. coli lysates generated from cells glucose starved for 4-h internalization timeframe. Three biological replicates are shown. b TQD-MS results showing relative VA concentrations in E. coli lysates following CCCP or vehicle control treatment for 4 h. Two biological replicates are shown. c Representative images of E. coli ± CCCP for 4 h internalization of the alkyne-modified VA mono-lignol (fVA) followed by fixation and AlexaFluor™ 647 labeling. d Single-cell microscopy analysis of fVA in E. coli cells treated with CCCP or vehicle control for 4 h. Single-cell integrated intensities are graphed, red lines mark mean, and whiskers mark standard deviation of > 10,000 cells per condition, representing three biological replicates. *Indicates p value of 0.014, and ****indicates p value of < 0.0001 by a t-test

References

    1. Thevenot M, Dignac M-F, Rumpel C. Fate of lignins in soils: a review. Soil Biol Biochem. 2010;42(8):1200–1211.
    1. Boerjan W, Ralph J, Baucher M. Lignin biosynthesis. Annu Rev Plant Biol. 2003;54:519–546. - PubMed
    1. Masai E, Katayama Y, Fukuda M. Genetic and biochemical investigations on bacterial catabolic pathways for lignin-derived aromatic compounds. Biosci Biotechnol Biochem. 2007;71(1):1–15. - PubMed
    1. Linger JG, Vardon DR, Guarnieri MT, Karp EM, Hunsinger GB, Franden MA, et al. Lignin valorization through integrated biological funneling and chemical catalysis. Proc Natl Acad Sci USA. 2014;111(33):12013–12018. - PMC - PubMed
    1. Abdelaziz OY, Brink DP, Prothmann J, Ravi K, Sun M, Garcia-Hidalgo J, et al. Biological valorization of low molecular weight lignin. Biotechnol Adv. 2016;34(8):1318–1346. - PubMed

LinkOut - more resources