. 2019 Jun 17:7:e7135.
doi: 10.7717/peerj.7135. eCollection 2019.

Comprehensive analysis of an lncRNA-miRNA-mRNA competing endogenous RNA network in pulpitis

Affiliations

Comprehensive analysis of an lncRNA-miRNA-mRNA competing endogenous RNA network in pulpitis

Fangcao Lei et al. PeerJ. .

Abstract

Background: Pulpitis is a common inflammatory disease that affects dental pulp. It is important to understand the molecular signals of inflammation and repair associated with this process. Increasing evidence has revealed that long noncoding RNAs (lncRNAs), via competitively sponging microRNAs (miRNAs), can act as competing endogenous RNAs (ceRNAs) to regulate inflammation and reparative responses. The aim of this study was to elucidate the potential roles of lncRNA, miRNA and messenger RNA (mRNA) ceRNA networks in pulpitis tissues compared to normal control tissues.

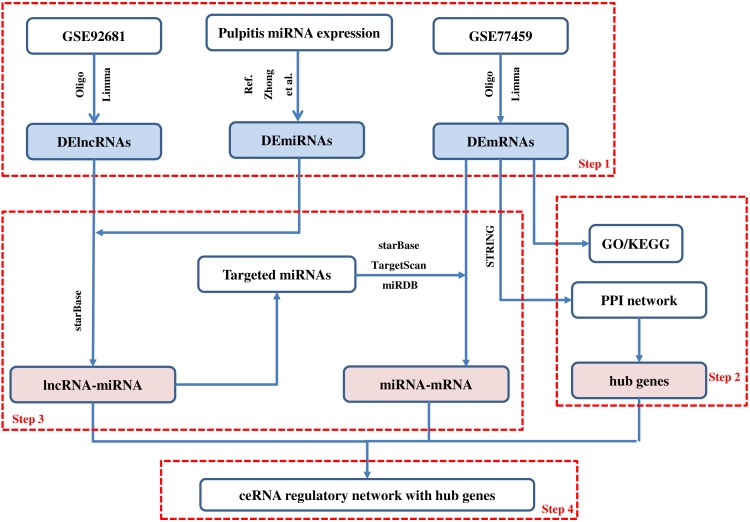
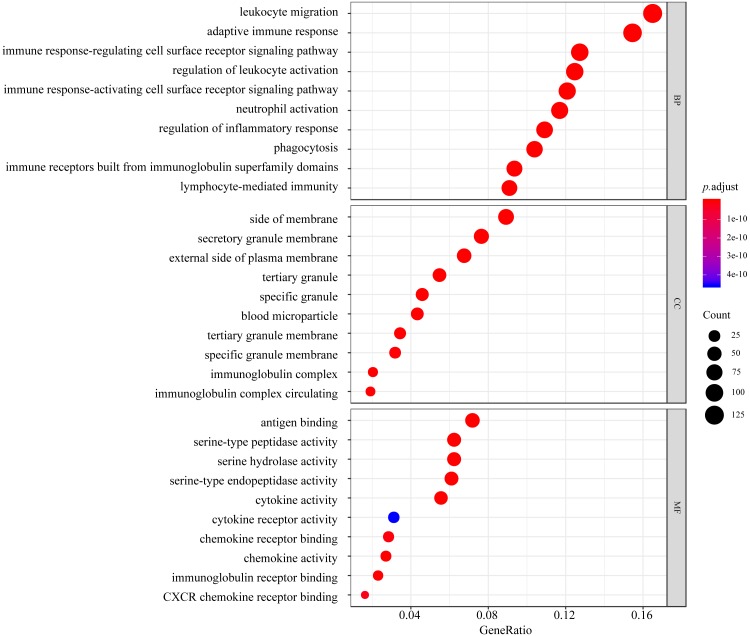
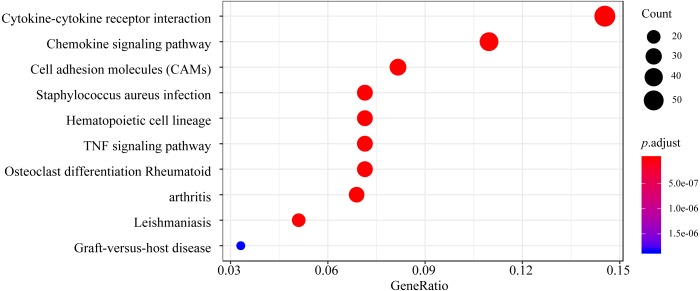
Methods: The oligo and limma packages were used to identify differentially expressed lncRNAs and mRNAs (DElncRNAs and DEmRNAs, respectively) based on expression profiles in two datasets, GSE92681 and GSE77459, from the Gene Expression Omnibus (GEO) database. Differentially expressed genes (DEGs) were further analyzed by Gene Ontology (GO) and Kyoto Encyclopedia of Genes and Genomes (KEGG) pathway enrichment analyses. Protein-protein interaction (PPI) networks and modules were established to screen hub genes using the Search Tool for the Retrieval of Interacting Genes/Proteins (STRING) and the Molecular Complex Detection (MCODE) plugin for Cytoscape, respectively. Furthermore, an lncRNA-miRNA-mRNA-hub genes regulatory network was constructed to investigate mechanisms related to the progression and prognosis of pulpitis. Then, quantitative real-time polymerase chain reaction (qRT-PCR) was applied to verify critical lncRNAs that may significantly affect the pathogenesis in inflamed and normal human dental pulp.

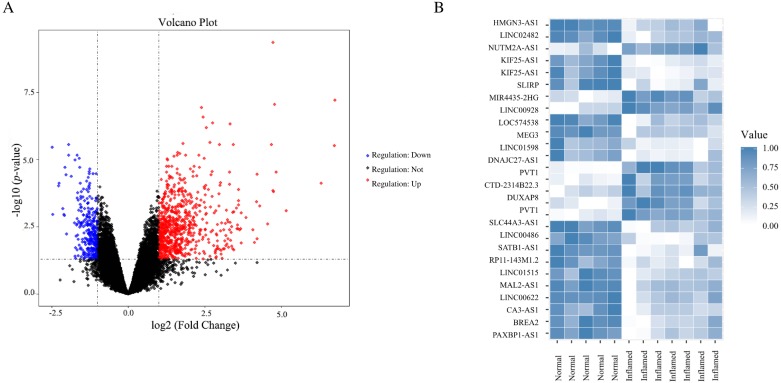
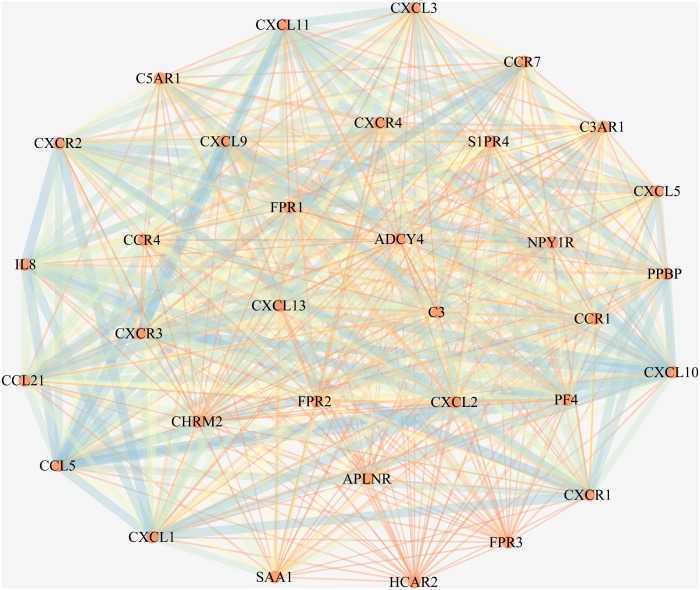
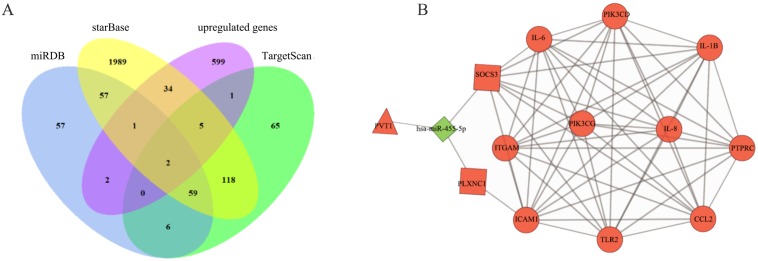
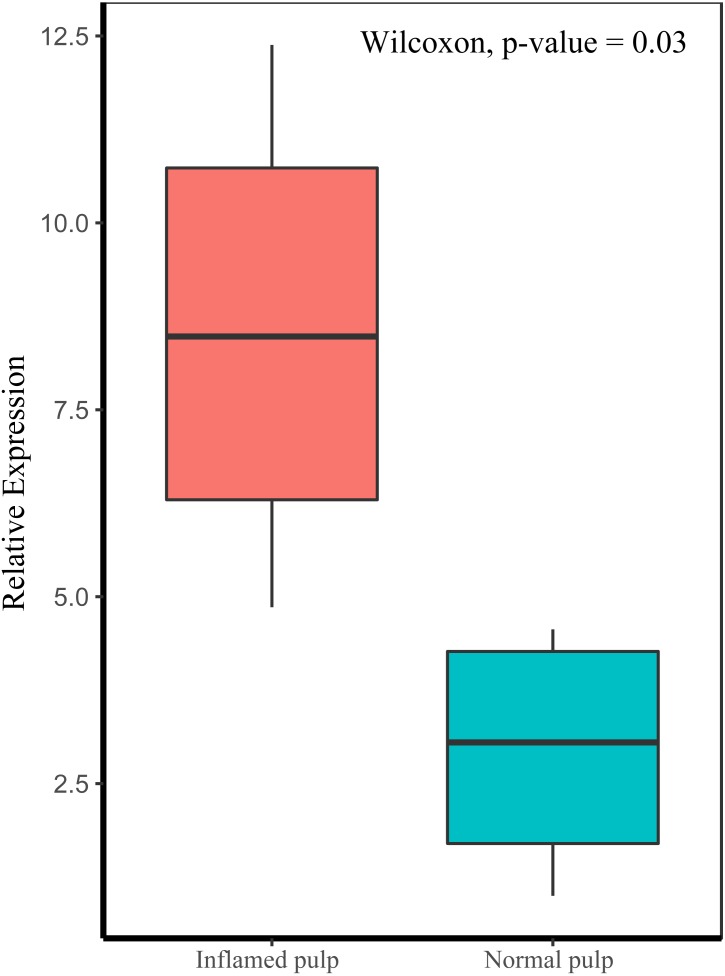
Results: A total of 644 upregulated and 264 downregulated differentially expressed genes (DEGs) in pulpitis samples were identified from the GSE77459 dataset, while 8 up- and 19 downregulated probes associated with lncRNA were identified from the GSE92681 dataset. Protein-protein interaction (PPI) based on STRING analysis revealed a network of DEGs containing 4,929 edges and 623 nodes. Upon combined analysis of the constructed PPI network and the MCODE results, 10 hub genes, including IL6, IL8, PTPRC, IL1B, TLR2, ITGAM, CCL2, PIK3CG, ICAM1, and PIK3CD, were detected in the network. Next, a ceRNA regulatory relationship consisting of one lncRNA (PVT1), one miRNA (hsa-miR-455-5p) and two mRNAs (SOCS3 and PLXNC1) was established. Then, we constructed the network in which the regulatory relationship between ceRNA and hub genes was summarized. Finally, our qRT-PCR results confirmed significantly higher levels of PVT1 transcript in inflamed pulp than in normal pulp tissues (p = 0.03).

Conclusion: Our study identified a novel lncRNA-mediated ceRNA regulatory mechanisms in the pathogenesis of pulpitis.

Keywords: Bioinformatics analysis; Competing endogenous RNA network; Long noncoding RNA; Pulpitis.


Conflict of interest statement

The authors declare there are no competing interests.

Figures

Figure 1
Figure 1. Main steps of the construction of the regulatory network in pulpitis.
Step 1: We identified the differentially expressed mRNAs, lncRNAs and miRNAs. Step 2: The GO and KEGG enrichment analyses were conducted and the PPI network was constructed. Then, we identified the hub genes from the PPI network. Step 3: The ceRNA regulatory relationships were predicted using online tools. Step 4: The ceRNA network with hub genes was constructed.
Figure 2
Figure 2. DEGs between pulpits samples and normal samples.
(A) Volcano plot for the DEGs in dataset GSE77459. The x-axis indicates the log FC, and the y-axis indicates the log10 (adjusted p-value). The red dots represent upregulated genes, and the blue dots represent downregulated genes. The DEGs were screened on the basis of a |fold change| > 1.0 and an adjusted p-value of < 0.05. The black dots represent genes with no significant difference. FC, fold change. (B) Heatmap of the DEGs in dataset GSE92681. The relative expression values were normalized to fall in a range from zero to one. Genes expressed at high levels are shown in blue, while those expressed at low levels are shown in white.
Figure 3
Figure 3. Top 10 processes revealed in GO enrichment to influence biological process (BP), molecular function (MF), and cellular component (CC).
The colored dots represent the term enrichment: blue indicates low enrichment, and red indicates high enrichment. The sizes of the dots represent the numbers of genes in each GO category.
Figure 4
Figure 4. Top 10 enriched KEGG pathways for the DEGs.
The y-axis shows the KEGG pathway names. The colored dots represent the term enrichment: blue indicates low enrichment, while red indicates high enrichment. The sizes of the dots represent the numbers of genes.
Figure 5
Figure 5. The most significant module in the PPI network of the DEGs.
The most significant module includes 528 edges and 33 nodes. The circles represent genes, and the lines represent interactions between the proteins encoded by the genes.
Figure 6
Figure 6. Construction of ceRNA network in pulpitis.
(A) Venn diagram showing the number of distinct and overlapping RNAs among the upregulated genes and the RNAs identified with miRDB, starBase, and TargetScan. The overlapping areas show the upregulated genes identified by three online tools. (B) Interaction of RNAs in the PVT1-associated ceRNA network. The triangle node and the diamond node represent the lncRNA and miRNA, respectively. The rectangle nodes represent miR-455-5p-targeted mRNAs. The round nodes are the top 10 hub DEmRNAs in the network. The up- and downregulated genes are colored in red and green, respectively.
Figure 7
Figure 7. Relative expression levels of PVT1 in inflamed and normal pulp tissue.
The transcript levels of PVT1 were determined by qRT-PCR and normalized to those of the reference RNA GAPDH. p-value = 0.03.

Similar articles

Cited by

References

    1. Afonso-Grunz F, Muller S. Principles of miRNA-mRNA interactions: beyond sequence complementarity. Cellular and Molecular Life Sciences. 2015;72:3127–3141. doi: 10.1007/s00018-015-1922-2. - DOI - PMC - PubMed
    1. Agarwal V, Bell GW, Nam JW, Bartel DP. Predicting effective microRNA target sites in mammalian mRNAs. Elife. 2015;4:e05005. doi: 10.7554/eLife.05005. - DOI - PMC - PubMed
    1. Arai T, Kojima S, Yamada Y, Sugawara S, Kato M, Yamazaki K, Naya Y, Ichikawa T, Seki N. Pirin: a potential novel therapeutic target for castration-resistant prostate cancer regulated by miR-455-5p. Molecular Oncology. 2019;13:322–337. doi: 10.1002/1878-0261.12405. - DOI - PMC - PubMed
    1. Ashburner M, Ball CA, Blake JA, Botstein D, Butler H, Cherry JM, Davis AP, Dolinski K, Dwight SS, Eppig JT, Harris MA, Hill DP, Issel-Tarver L, Kasarskis A, Lewis S, Matese JC, Richardson JE, Ringwald M, Rubin GM, Sherlock G. Gene ontology: tool for the unification of biology. The gene ontology consortium. Nature Genetics. 2000;25:25–29. doi: 10.1038/75556. - DOI - PMC - PubMed
    1. Bender IB. Pulpal pain diagnosis—a review. Journal of Endodontics. 2000;26:175–179. doi: 10.1097/00004770-200003000-00012. - DOI - PubMed