. 2019 Jun 3:3:9.
doi: 10.1038/s41538-019-0042-z. eCollection 2019.

Suppression of olfactory signal transduction by insecticides

Affiliations

Suppression of olfactory signal transduction by insecticides

Hiroko Takeuchi et al. NPJ Sci Food. .

Abstract

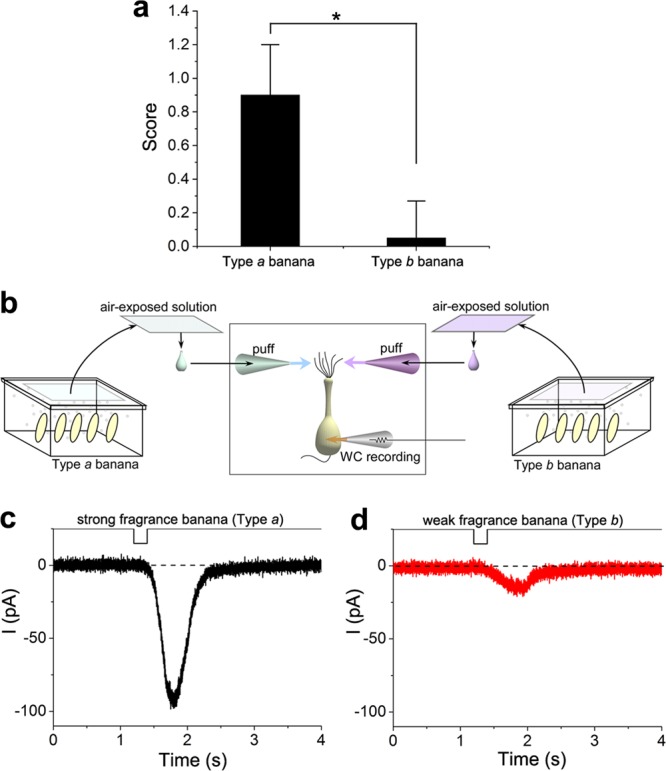
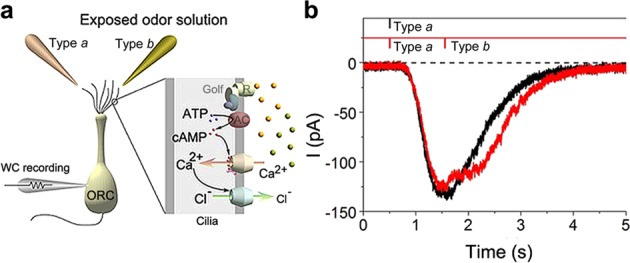
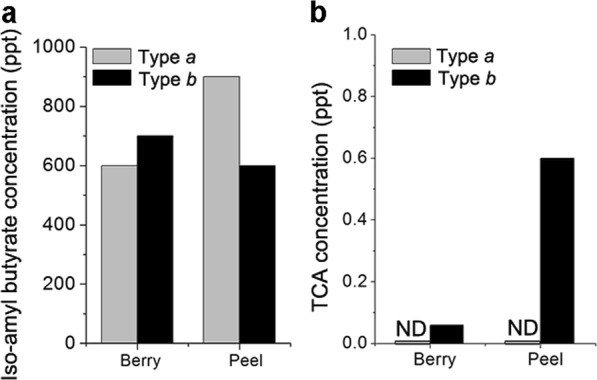
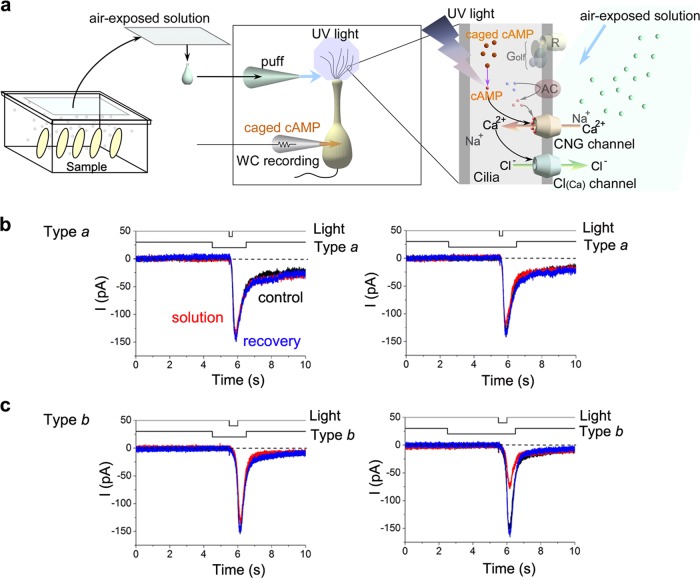
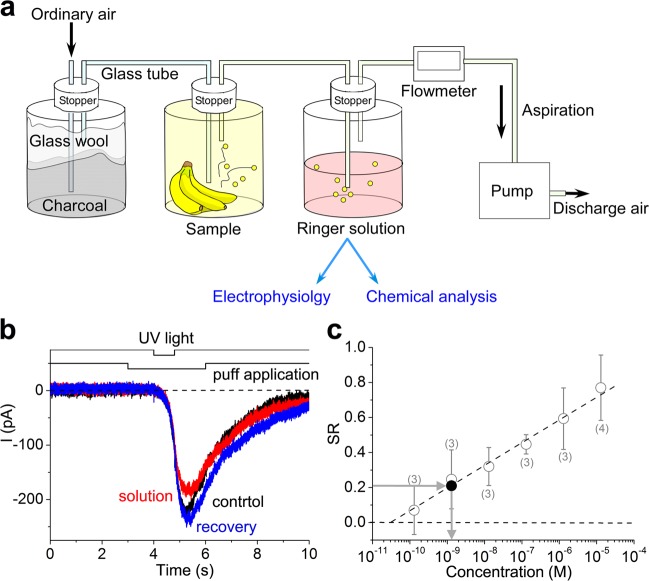
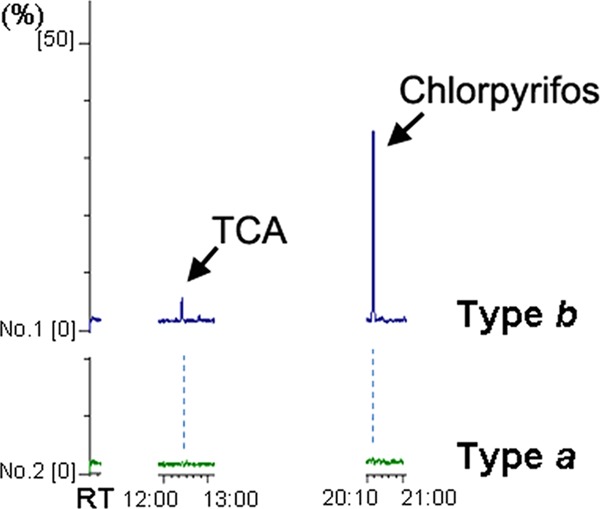
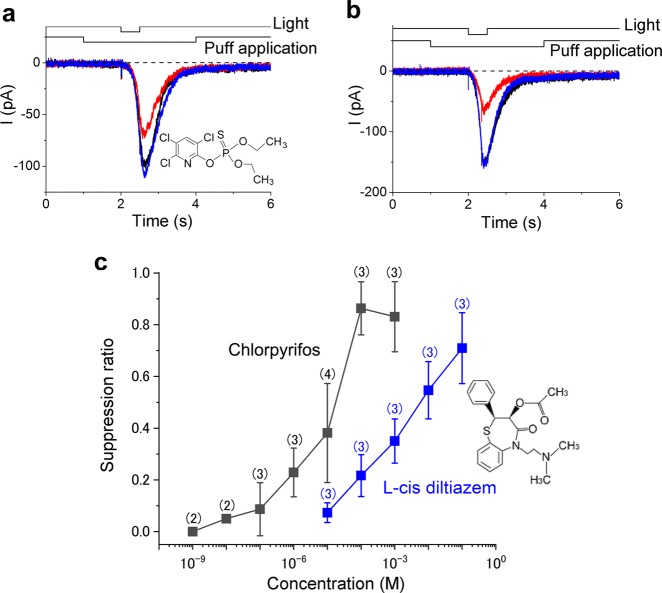
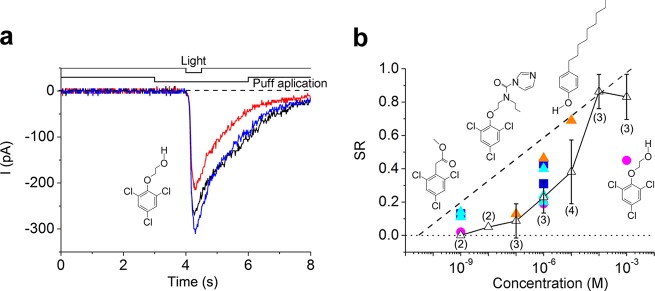
2,4,6-Trichloroanisole (TCA) is a well-known, potent off-flavour compound present in various foods and beverages. TCA has been hypothesised to be a universal cause of flavour loss experienced in daily life. Here, however, we show that titres for the suppression of olfactory transducer channels caused by low-quality bananas are much higher than those for that caused by the TCA itself contained in the banana. We resurveyed other components of low-quality bananas and found that bananas also contain an insecticide (chlorpyrifos), and that it suppresses olfactory transducer channels. Other insecticides also suppressed olfactory transducer channels. Hence, even after passing safety examinations, certain insecticides may decrease the quality of foods and beverages by reducing their intrinsic scents.

Keywords: Cyclic nucleotide-gated cation channels; Inhibition; Olfactory receptors.


Conflict of interest statement

Competing interestsThe authors declare no competing interests.

Figures

Fig. 1
Fig. 1
Cell responses to vapours from bananas. a Evaluation of banana flavour. Forty evaluators choose the stronger banana-like scent one from two bananas (paired test). For analyses, the score for selected banana was set to 1 and another 0. When the evaluator selected neither, both were 0. There is a significant statistical difference by Welch’s t test (*p < 0.05). b Scheme of cell stimulation; two puffer pipettes contained stimulants originated from type a or type b bananas. Sliced bananas were placed in containers for 3 h and volatile molecules in containers were adsorbed into filter papers that were wetted with normal Ringer’s solution and were adhered to the back of the lid. Solutions were then squeezed and applied to single olfactory receptor cells (ORCs) under the voltage clamp. c Current responses to stimulants from strong smelling bananas (type a). d Current responses to stimulants from weak smelling bananas (type b). b, c were obtained from the same ORC. The same banana samples (type a and b) were used for human psychology tests and cell experiments throughout ad
Fig. 2
Fig. 2
Cell response was suppressed by vapours from bananas. a Experimental scheme with a cytoplasmic molecular cascade. b Single pulse responses to the stimulant from type a bananas. Exposed-odour solution from type a banana induced an inward current (black). Current response to a double pulse stimulation (red). Note that the stimulant from type b banana suppressed the response to that from type a banana
Fig. 3
Fig. 3
Analysis of fragrance components from bananas using GC/MS. a Concentrations of iso-amyl butyrate in type a and b bananas. b Concentrations of 2,4,6-trichloroanisole (TCA) in type a and b bananas; ND, not detected
Fig. 4
Fig. 4
Vapours suppress cAMP-induced currents. a Scheme of protocol. b Current suppression by type a; stimulus solution was applied at 1 s (left) and 3 s (right) before light stimulation. Black trace (almost completely hidden by other traces) shows a current response to a cytoplasmic cAMP. Red trace shows the same response during a puff application of air-exposed solution from the banana a samples. Blue trace shows a recovery. Stimulants were applied at 1 s (left) and 3 s (right) before the light stimulation. The cell showed no response to banana vapours. c Current suppression by type b compounds. Colours of traces, control = black, red = stimulants, blue = recovery, were used throughout the text
Fig. 5
Fig. 5
Estimation of 2,4,6-trichloroanisole (TCA). a Scheme showing procedures for the collection of volatile components; bubbling time, 17 h. b Effect of Ringer’s solution bubbled with vapours from type b bananas; puff duration, 3 s until 1 s before light stimulation; suppression ratio = 0.21. A cell showing no response to banana vapours; pressure 50 kPa. c Estimation of TCA concentrations; the calibration curve was obtained from a previous work (white circles). Estimated TCA concentration from the degree of suppression was 1.3 nM (black full circle)
Fig. 6
Fig. 6
Measurements of components from type a and b bananas using GC/MS. Left column shows 2,4,6-trichloroanisole (TCA), right column chlorpyrifos in type a and b banana. The bananas were once frozen at −20 °C for stock. Y-axis shows relative percentage, and X-axis the retention time (RT)
Fig. 7
Fig. 7
Comparison of current suppression by chlorpyrifos and l-cis diltiazem. a Current suppression by 1 μM chlorpyrifos; suppression ratio (SR) = 0.29. b Current suppression by 10 μM chlorpyrifos; SR = 0.48. c Dose–suppression relationships of chlorpyrifos (black full squares) and l-cis diltiazem (blue full squares, data from ref. )
Fig. 8
Fig. 8
Current suppression by chlorpyrifos and insecticides. a, Current suppression by 1-μM 2,4,6-TPE (Log D = 3.36) SR = 0.19. b Dose–suppression relationship; blue full squares, prochloraz (Log D = 4.14, 3 cells); light blue full triangles, 2,4,6-TPA (Log D = 3.86, 5 cells); Pink full circles, 2,4,6-TPE (Log D = 3.36, 3 cells); orange full triangles, 4-nonylphenol (Log D = 6.13, 3 cells). White triangles, chlorpyrifos (Log D = 4.78); data were obtained from those reported in Fig. 5c. Dotted lines show the 2,4,6-TCA) calibration curve

Similar articles

Cited by

References

    1. Buser HR, Zanier C, Tanner H. Identification of 2,4,6-trichloroanisole as a potent compound causing cork taint in wine. J. Agric. Food Chem. 1982;30:359–362. doi: 10.1021/jf00110a037. - DOI
    1. Evans TJ, Butzke CE, Ebeler SE. Analysis of 2,4,6-trichloroanisole in wines using solid-phase microextraction coupled to gas chromatography-mass spectrometry. J. Chromatogr. A. 1997;786:293–298. doi: 10.1016/S0021-9673(97)00581-5. - DOI - PubMed
    1. Taylor MK, Young TM, Butzke CE, Ebeler SE. Supercritical fluid extraction of 2,4,6-trichloroanisole from cork stoppers. J. Agric. Food Chem. 2000;48:220–2011. doi: 10.1021/jf9909757. - DOI - PubMed
    1. Alvarez-Rodriguez ML, et al. Cork taint of wines: role of the filamentous fungi isolated from cork in the formation of 2,4,6-trichloroanisole by o methylation of 2,4,6-trichlorophenol. Appl. Environ. Microbiol. 2002;68:5860–5869. doi: 10.1128/AEM.68.12.5860-5869.2002. - DOI - PMC - PubMed
    1. Silva Teixeira CS, Silva Ferreira AC, Cerqueira NM. Studying haloanisoles interaction with olfactory receptors. ACS Chem. Neurosci. 2016;7:870–885. doi: 10.1021/acschemneuro.5b00335. - DOI - PubMed