

Predicting scheduled hospital attendance with artificial intelligence
- PMID: 31304373
- PMCID: PMC6550247
- DOI: 10.1038/s41746-019-0103-3
Predicting scheduled hospital attendance with artificial intelligence
Abstract
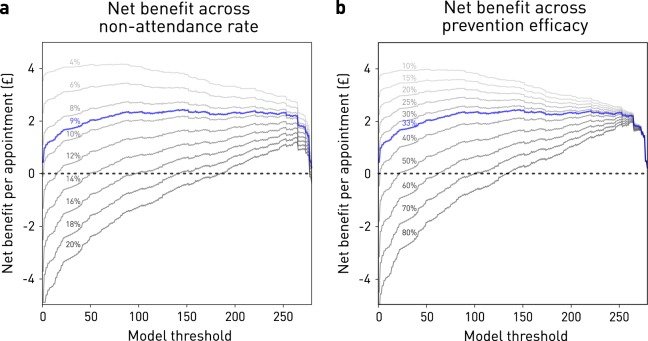
Failure to attend scheduled hospital appointments disrupts clinical management and consumes resource estimated at £1 billion annually in the United Kingdom National Health Service alone. Accurate stratification of absence risk can maximize the yield of preventative interventions. The wide multiplicity of potential causes, and the poor performance of systems based on simple, linear, low-dimensional models, suggests complex predictive models of attendance are needed. Here, we quantify the effect of using complex, non-linear, high-dimensional models enabled by machine learning. Models systematically varying in complexity based on logistic regression, support vector machines, random forests, AdaBoost, or gradient boosting machines were trained and evaluated on an unselected set of 22,318 consecutive scheduled magnetic resonance imaging appointments at two UCL hospitals. High-dimensional Gradient Boosting Machine-based models achieved the best performance reported in the literature, exhibiting an area under the receiver operating characteristic curve of 0.852 and average precision of 0.511. Optimal predictive performance required 81 variables. Simulations showed net potential benefit across a wide range of attendance characteristics, peaking at £3.15 per appointment at current prevalence and call efficiency. Optimal attendance prediction requires more complex models than have hitherto been applied in the field, reflecting the complex interplay of patient, environmental, and operational causal factors. Far from an exotic luxury, high-dimensional models based on machine learning are likely essential to optimal scheduling amongst other operational aspects of hospital care. High predictive performance is achievable with data from a single institution, obviating the need for aggregating large-scale sensitive data across governance boundaries.
Keywords: Health care economics; Health policy; Magnetic resonance imaging.
Conflict of interest statement
Competing interestsThe authors declare no competing interests.
Figures


Similar articles
-
A Machine Learning Approach to Predicting Need for Hospitalization for Pediatric Asthma Exacerbation at the Time of Emergency Department Triage.Acad Emerg Med. 2018 Dec;25(12):1463-1470. doi: 10.1111/acem.13655. Epub 2018 Nov 29. Acad Emerg Med. 2018. PMID: 30382605
-
Predicting post-stroke pneumonia using deep neural network approaches.Int J Med Inform. 2019 Dec;132:103986. doi: 10.1016/j.ijmedinf.2019.103986. Epub 2019 Oct 1. Int J Med Inform. 2019. PMID: 31629312
-
A hospital wide predictive model for unplanned readmission using hierarchical ICD data.Comput Methods Programs Biomed. 2019 May;173:177-183. doi: 10.1016/j.cmpb.2019.02.007. Epub 2019 Feb 13. Comput Methods Programs Biomed. 2019. PMID: 30777619
-
Machine learning analyses can differentiate meningioma grade by features on magnetic resonance imaging.Neurosurg Focus. 2018 Nov 1;45(5):E4. doi: 10.3171/2018.8.FOCUS18191. Neurosurg Focus. 2018. PMID: 30453458
-
Emergency department triage prediction of clinical outcomes using machine learning models.Crit Care. 2019 Feb 22;23(1):64. doi: 10.1186/s13054-019-2351-7. Crit Care. 2019. PMID: 30795786 Free PMC article.
Cited by
-
Development and application of survey-based artificial intelligence for clinical decision support in managing infectious diseases: A pilot study on a hospital in central Vietnam.Front Public Health. 2022 Nov 2;10:1023098. doi: 10.3389/fpubh.2022.1023098. eCollection 2022. Front Public Health. 2022. PMID: 36438286 Free PMC article.
-
Machine learning in patient flow: a review.Prog Biomed Eng (Bristol). 2021 Apr;3(2):022002. doi: 10.1088/2516-1091/abddc5. Epub 2021 Feb 22. Prog Biomed Eng (Bristol). 2021. PMID: 34738074 Free PMC article. Review.
-
It's how you say it: Systematic A/B testing of digital messaging cut hospital no-show rates.PLoS One. 2020 Jun 23;15(6):e0234817. doi: 10.1371/journal.pone.0234817. eCollection 2020. PLoS One. 2020. PMID: 32574181 Free PMC article.
-
Key challenges for delivering clinical impact with artificial intelligence.BMC Med. 2019 Oct 29;17(1):195. doi: 10.1186/s12916-019-1426-2. BMC Med. 2019. PMID: 31665002 Free PMC article.
-
Redefining the research hospital.NPJ Digit Med. 2019 Dec 6;2:119. doi: 10.1038/s41746-019-0201-2. eCollection 2019. NPJ Digit Med. 2019. PMID: 31840090 Free PMC article. No abstract available.
References
-
- Hospital Outpatient Activity, 2017–18. NHS Digital. Available at: https://digital.nhs.uk/data-and-information/publications/statistical/hos.... Accessed 20 Feb 2019.
-
- NHS England. Heart patients among those to benefit as NHS England backs innovation. Available at: https://www.england.nhs.uk/2018/04/heart-patients-among-those-to-benefit.... Accessed 19 Feb 2019.
-
- Lee, G. et al. Leveraging on predictive analytics to manage clinic no show and improve accessibility of care. In 2017 IEEE International Conference on Data Science and Advanced Analytics (DSAA) 429–438. 10.1109/DSAA.2017.25 (2017).
Grants and funding
LinkOut - more resources
Full Text Sources
Molecular Biology Databases
Miscellaneous
