. 2019 Apr 30:2:31.
doi: 10.1038/s41746-019-0105-1. eCollection 2019.

Deep learning predicts hip fracture using confounding patient and healthcare variables

Affiliations

Deep learning predicts hip fracture using confounding patient and healthcare variables

Marcus A Badgeley et al. NPJ Digit Med. .

Abstract

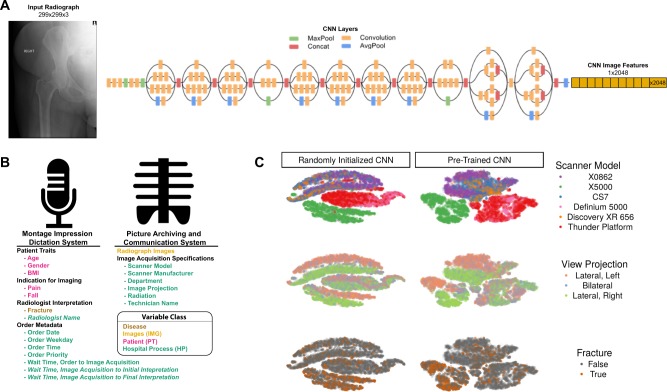
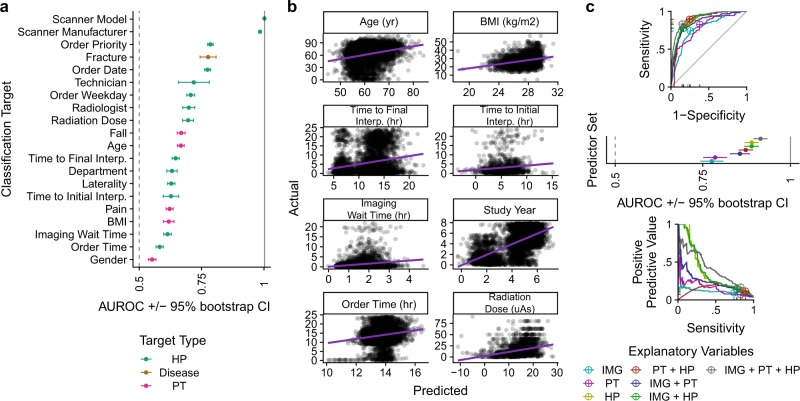
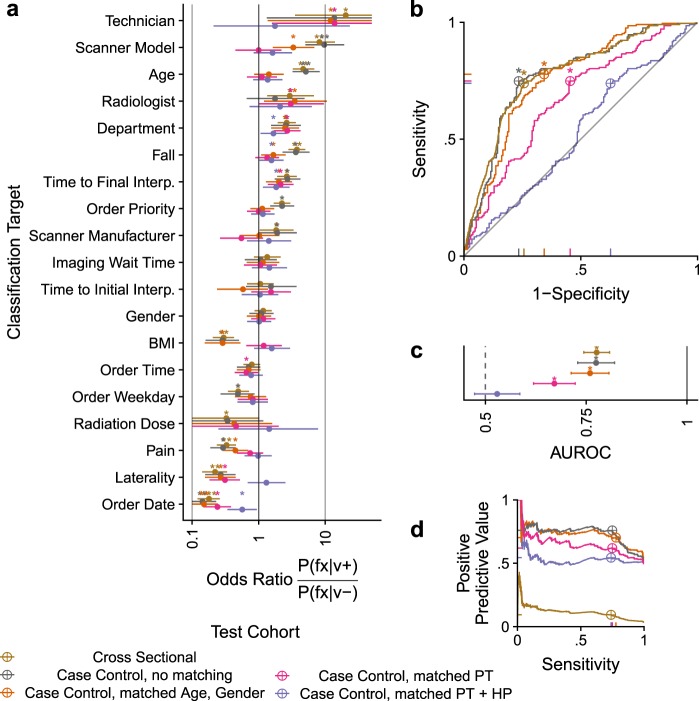
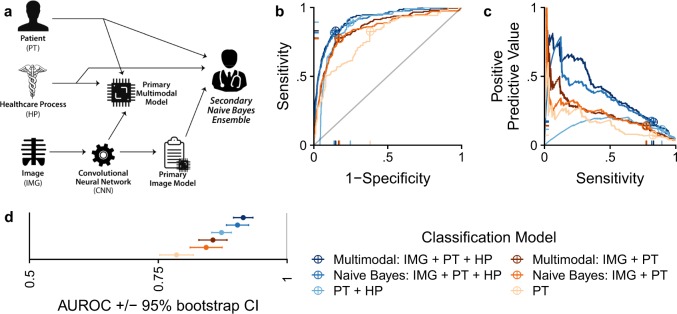
Hip fractures are a leading cause of death and disability among older adults. Hip fractures are also the most commonly missed diagnosis on pelvic radiographs, and delayed diagnosis leads to higher cost and worse outcomes. Computer-aided diagnosis (CAD) algorithms have shown promise for helping radiologists detect fractures, but the image features underpinning their predictions are notoriously difficult to understand. In this study, we trained deep-learning models on 17,587 radiographs to classify fracture, 5 patient traits, and 14 hospital process variables. All 20 variables could be individually predicted from a radiograph, with the best performances on scanner model (AUC = 1.00), scanner brand (AUC = 0.98), and whether the order was marked "priority" (AUC = 0.79). Fracture was predicted moderately well from the image (AUC = 0.78) and better when combining image features with patient data (AUC = 0.86, DeLong paired AUC comparison, p = 2e-9) or patient data plus hospital process features (AUC = 0.91, p = 1e-21). Fracture prediction on a test set that balanced fracture risk across patient variables was significantly lower than a random test set (AUC = 0.67, DeLong unpaired AUC comparison, p = 0.003); and on a test set with fracture risk balanced across patient and hospital process variables, the model performed randomly (AUC = 0.52, 95% CI 0.46-0.58), indicating that these variables were the main source of the model's fracture predictions. A single model that directly combines image features, patient, and hospital process data outperforms a Naive Bayes ensemble of an image-only model prediction, patient, and hospital process data. If CAD algorithms are inexplicably leveraging patient and process variables in their predictions, it is unclear how radiologists should interpret their predictions in the context of other known patient data. Further research is needed to illuminate deep-learning decision processes so that computers and clinicians can effectively cooperate.

Keywords: Computer science; Radiography; Statistics.


Conflict of interest statement

Competing interestsM.A.B. has received consulting fees from Whiteboard Coordinator, Inc. J.T.D. has received consulting fees or honoraria from Janssen Pharmaceuticals, GlaxoSmithKline, AstraZeneca, and Hoffman-La Roche. J.T.D. is a scientific advisor to L.A.M. Therapeutics and holds equity in NuMedii, Ayasdi, and Ontomics. M.L., M.V.M., and T.M.S. are employees of Verily Life Sciences.

Figures

Fig. 1
Fig. 1
The main source of variation in whole radiographs is explained by the device used to capture the radiograph. a Schematic of the inception v-3 deep learning model used to featurize radiographs into an embedded 2048-dimensional representation. Inception model architecture schematic derived from https://cloud.google.com/tpu/docs/inception-v3-advanced. b Data were collected from two sources. Variables were categorized as pathology (gold), image (IMG, yellow), patient, (PT, pink), or hospital process (HP, green). Italicized variables are not known at the time of image acquisition and are not used as explanatory variables. c The distribution of radiographs projected into clusters by t-Distributed Stochastic Neighbor Embedding (t-SNE) and designates how the unsupervised distribution of clusters relates to hip fracture and categorical variables
Fig. 2
Fig. 2
Deep-learning predicts all patient and hospital processes from a radiograph. a Deep-learning image models to predict binarized forms of 14 HP variables, 5 PT variables, and hip fracture. Error bars indicate the 95% confidence intervals of 2000 bootstrapped samples. b Deep-learning regression models to predict eight continuous variables from hip radiographs. Each dot represents one radiograph, and the purple lines are linear models of actual versus predicted values. c ROC, ROC+/− bootstrap confidence intervals, and precision recall curves for deep-learning models that predict fracture based on combinatorial predictor sets of IMG, PT, and HP variables. Crosshairs indicate the best operating point on ROC and PRC curves
Fig. 3
Fig. 3
Deep-learning hip fracture from radiographs is successful until controlling for all patient and hospital process variables. a The association between each metadata variable and fracture, colored by how the test cohort is sampled. (*) indicate a Fisher’s Exact test with p < 0.05. (b) ROC and (d) precision recall curves for the image-classifier tested on differentially sampled test sets. The best operating point is indicated with crosshairs. (*) represents a 95% confidence interval that does not include 0.5. c Summary of (b) with 95% bootstrap confidence intervals
Fig. 4
Fig. 4
Deep learning a compendium of patient data by directly combining image features, PT, and HP variables in multimodal models, or by secondarily ensembling image-only model predictions with PT and HP variables. a experiment schematic demonstrating the CAD simulation scenario wherein a physician secondarily integrates image-only and other clinical data (as modeled in a Naive Bayes ensemble). b ROC and (c) precision recall curves for classifiers tested on differentially sampled test sets. The best operating point is indicated with crosshairs. d Summary of (b) with 95% bootstrap confidence intervals

Similar articles

Cited by

References

    1. Johnell O, Kanis JA. An estimate of the worldwide prevalence, mortality and disability associated with hip fracture. Osteoporos. Int. 2004;15:897–902. doi: 10.1007/s00198-004-1627-0. - DOI - PubMed
    1. Haentjens P, et al. Meta-analysis: excess mortality after hip fracture among older women and men. Ann. Intern. Med. 2010;152:380–390. doi: 10.7326/0003-4819-152-6-201003160-00008. - DOI - PMC - PubMed
    1. Ward, R. J. et al. ACR Appropriateness Criteria® Acute HipPain—Suspected Fracture. https://acsearch.acr.org/docs/3082587/Narrative/ (2018).
    1. Kirby MW, Spritzer C. Radiographic detection of hip and pelvic fractures in the emergency department. Am. J. Roentgenol. 2010;194:1054–1060. doi: 10.2214/AJR.09.3295. - DOI - PubMed
    1. Cannon J, Silvestri S, Munro M. Imaging choices in occult hip fracture. J. Emerg. Med. 2009;37:144–152. doi: 10.1016/j.jemermed.2007.12.039. - DOI - PubMed