. 2019 Jun 7:2:48.
doi: 10.1038/s41746-019-0112-2. eCollection 2019.

Development and validation of a deep learning algorithm for improving Gleason scoring of prostate cancer

Affiliations

Development and validation of a deep learning algorithm for improving Gleason scoring of prostate cancer

Kunal Nagpal et al. NPJ Digit Med. .

Erratum in

Abstract

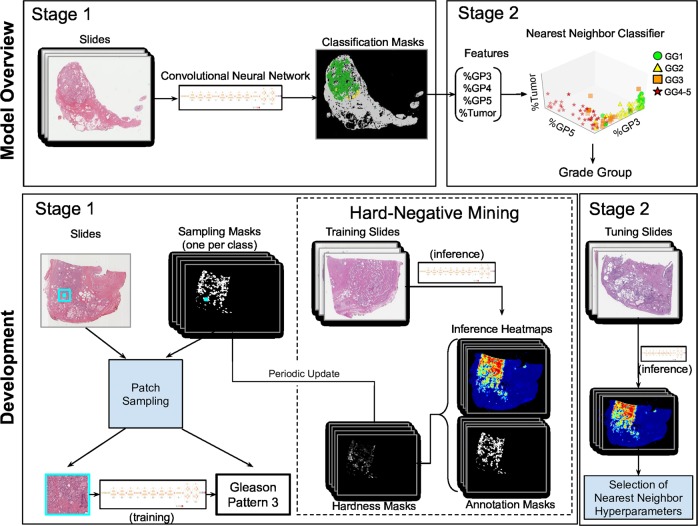
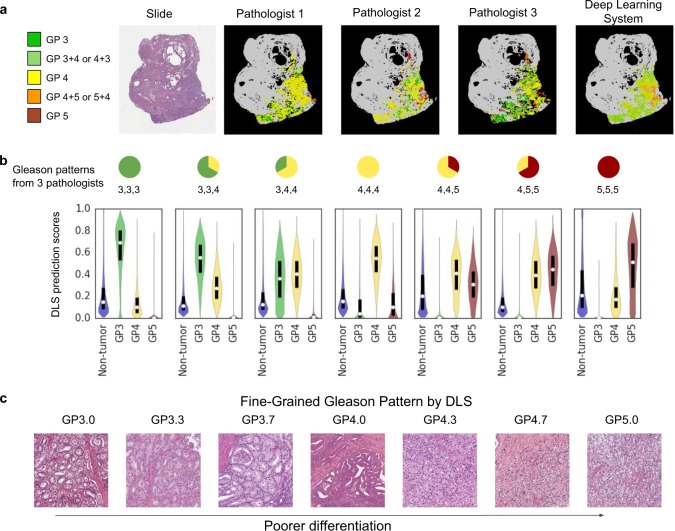
For prostate cancer patients, the Gleason score is one of the most important prognostic factors, potentially determining treatment independent of the stage. However, Gleason scoring is based on subjective microscopic examination of tumor morphology and suffers from poor reproducibility. Here we present a deep learning system (DLS) for Gleason scoring whole-slide images of prostatectomies. Our system was developed using 112 million pathologist-annotated image patches from 1226 slides, and evaluated on an independent validation dataset of 331 slides. Compared to a reference standard provided by genitourinary pathology experts, the mean accuracy among 29 general pathologists was 0.61 on the validation set. The DLS achieved a significantly higher diagnostic accuracy of 0.70 (p = 0.002) and trended towards better patient risk stratification in correlations to clinical follow-up data. Our approach could improve the accuracy of Gleason scoring and subsequent therapy decisions, particularly where specialist expertise is unavailable. The DLS also goes beyond the current Gleason system to more finely characterize and quantitate tumor morphology, providing opportunities for refinement of the Gleason system itself.

Keywords: Prostate cancer.


Conflict of interest statement

Competing interestsK.N., D.F., Y.L., P.-H.C.C., E.W., F.T., G.S.C., R.M.D., L.H.P., C.H.M., J.D.H. and M.C.S. are employees of Google LLC and own Alphabet stock.

Figures

Fig. 1
Fig. 1
Illustration of the development and usage of the two-stage deep learning system (DLS). Developing the DLS involves training two machine learning models. Stage 1 is an ensembled deep convolutional neural network (CNN) that classifies every region in the slide as non-tumor or its Gleason pattern (GP). Training the stage 1 CNN involves first collecting pathologists’ annotations (Annotation Masks) of whole-slide images at the region level, and then generating “sampling masks” indicating the locations of each of the four classes (non-tumor, GP3, GP4, and GP5) for each slide. Over the course of millions of training iterations, sampled image patches and associated labels are used to train the constituent CNNs in the ensembled stage 1 CNN model. During the training process, we performed hard-negative mining by periodically applying each individual partially trained model to the entire training corpus of whole-slide images. Comparison of these intermediate inference results to the original annotations highlights the most difficult image patches, and we focus training on these patches. Stage 2 involves first collecting pathologists’ labels of the Gleason Grade Group (GG) for each slide. Next, the predictions of the stage 1 model are calibrated and converted to four features that indicate the amount of tumor and each GP in the slide. k-nearest-neighbor (kNN) classifiers are then trained to predict the GG (1, 2, 3, or 4–5), or whether the GG is above specific thresholds (GG ≥ 2, GG ≥ 3, or GG ≥ 4). For more details, please refer to the “Deep Learning System” section in the Supplement
Fig. 2
Fig. 2
Comparison of prostate cancer Gleason scoring performance of the deep learning system (DLS) with pathologists. a Accuracy of the DLS (in red) compared with the mean accuracy among a cohort-of-29 pathologists (in green). Accuracy is defined as exact agreement with the reference standard, which is provided by genitourinary specialists (see Methods). Error bars indicate 95% confidence intervals, and p-value is the result of a two-sided permutation test (see “Statistical Analysis” section in the manuscript and the Supplement). b Accuracy of the DLS compared to 10 individual pathologists (among the cohort of 29, indicated by pathologists A–J) who reviewed all of the slides in the validation set. See eTable 4 in the Supplement for more details. c The receiver operating characteristic curves compare the sensitivity and specificity of the DLS with individual pathologists and the cohort-of-29 pathologists for binary classification of whether the Gleason Grade Group (GG) is above the thresholds of GG ≥ 2, GG ≥ 3, and GG ≥ 4. Area under the receiver operating characteristic curves and associated 95% confidence intervals for the DLS are provided in the legend. Higher and to the left indicates better performance
Fig. 3
Fig. 3
Comparison of the deep learning system (DLS) with pathologists for Gleason Pattern (GP) quantitation. Each dot indicates the mean average error (lower is better) for Gleason pattern quantitation, with error bars show the 95% confidence intervals. Left: overall Gleason pattern quantification results among all slides. Right: subgroup analysis where Gleason pattern quantification is of particular importance: Grade Group 2–3 slides where percent of Gleason pattern 4 can change the overall Grade Group, and Grade Group 4–5 slides where percent of Gleason pattern 5 reporting is recommended by the College of American Pathologists
Fig. 4
Fig. 4
Assessing the region-level classification of the DLS. a Three pathologists annotated this slide with general concordance on the localization of tumor areas, but poor agreement on the associated Gleason patterns: a “pure” grade like Gleason pattern 3, 4, or 5, or a mixed grade comprising features of more than one pure pattern. The DLS assigned each image patch to a fine-grained Gleason pattern, as illustrated by the colors interpolating between Gleason patterns 3 (green), 4 (yellow), and 5 (red). See the “Fine-grained Gleason Pattern” section in the Supplement. b Quantification of the observations from panel a across 79 slides (41 million annotated image patches) for which three pathologists exhaustively categorized every slide. The violin plots indicate DLS prediction-likelihood distributions. The white dots and black bars identify medians and interquartile ranges, respectively. The predicted likelihood of each Gleason pattern by the DLS changes smoothly with the pathologists’ classification distribution. See Supplementary Fig. 2 for a similar analysis on images with mixed-grade labels. c The continuum of Gleason patterns learned by the DLS reveals finer categorization of the well-to-poorly differentiated spectrum (see “Fine-grained Gleason Pattern” section in the Supplement). Each displayed image region is the region closest (of millions in our validation dataset) to its labeled quantitative Gleason pattern. Columns 1, 4, and 7 represent regions for which the highest confidence predictions are Gleason patterns 3, 4, and 5, respectively. The columns in between represent quantitative Gleason patterns between these defined categories. See Supplementary Fig. 3 for additional examples
Fig. 5
Fig. 5
Comparison of risk stratification between pathologists, deep learning system, and the specialist-defined reference standard. a Concordance index provided by each entity’s Grade Group (GG) classification (GGs 1, 2, 3, 4–5) in stratifying adverse clinical endpoints of disease progression or biochemical recurrence (BCR) (see “Clinical Follow-up Data” in Methods). Ninety-five percent confidence intervals were obtained by bootstrapping. For the cohort-of-29 pathologists, the median c-index is reported (see “Statistical Analysis” in Supplementary Methods). b Kaplan–Meier curves using a binary threshold (GG ≥ 3) for risk stratification. Dotted lines correspond to the lower risk group (GG1-2) and solid lines correspond to the higher risk group (GG3-5). A larger separation between the risk groups indicates better risk stratification. Tick marks indicate censorship events. For the cohort-of-29 pathologists, analyses of sampled Grade Group classifications that produced a median hazard ratio are plotted here (see “Statistical Analysis” in Supplementary Methods)

Comment in

References

    1. Prostate Cancer—Cancer Stat Facts. https://seer.cancer.gov/statfacts/html/prost.html. Accessed 22 August 2018.
    1. Epstein JI, et al. A contemporary prostate cancer grading system: a validated alternative to the Gleason score. Eur. Urol. 2016;69:428–435. doi: 10.1016/j.eururo.2015.06.046. - DOI - PMC - PubMed
    1. Epstein JI, Allsbrook WC, Amin MB, Egevad LL. The 2005 International Society of Urological Pathology (ISUP) consensus conference on gleason grading of prostatic carcinoma. Am. J. Surg. Pathol. 2005;29:1228–1242. doi: 10.1097/01.pas.0000173646.99337.b1. - DOI - PubMed
    1. Epstein, J. I. et al. The 2014 International Society of Urological Pathology (ISUP) Consensus Conference on Gleason Grading of Prostatic Carcinoma: Definition of Grading Patterns and Proposal for a New Grading System. Am. J. Surg. Pathol. 40, 244–252 (2016). - PubMed
    1. NCCN Clinical Practice Guidelines in Oncology. https://www.nccn.org/professionals/physician_gls/default.aspx#prostate. Accessed 14 August 2018.