

Circulating 25-Hydroxyvitamin D Concentrations in Overweight and Obese Adults Are Explained by Sun Exposure, Skin Reflectance, and Body Composition
- PMID: 31304455
- PMCID: PMC6616201
- DOI: 10.1093/cdn/nzz065
Circulating 25-Hydroxyvitamin D Concentrations in Overweight and Obese Adults Are Explained by Sun Exposure, Skin Reflectance, and Body Composition
Abstract
Background: Obese individuals are known to be at higher risk for vitamin D deficiency than normal-weight individuals. Cutaneous synthesis is a major source of vitamin D; however, objective measurements of sun exposure are lacking in this population.
Objective: To assess the validity of a regression model using sun exposure in lean individuals to estimate serum 25-hydroxyvitamin D [25(OH)D] in overweight and obese individuals, and to develop a prediction equation for serum 25(OH)D in overweight and obese adults.
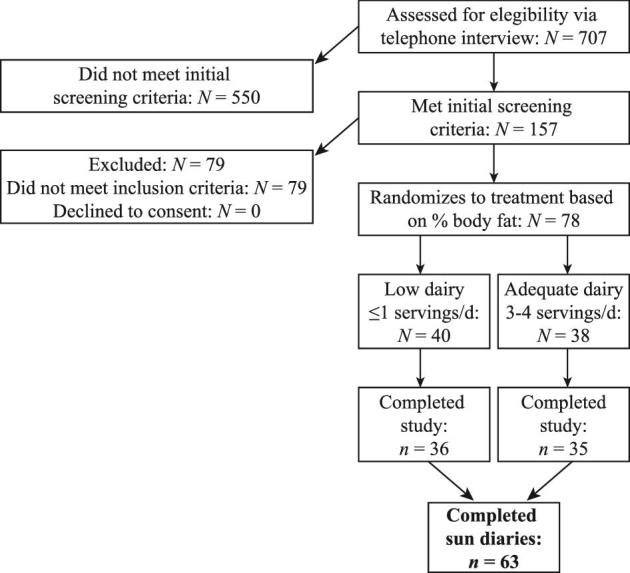
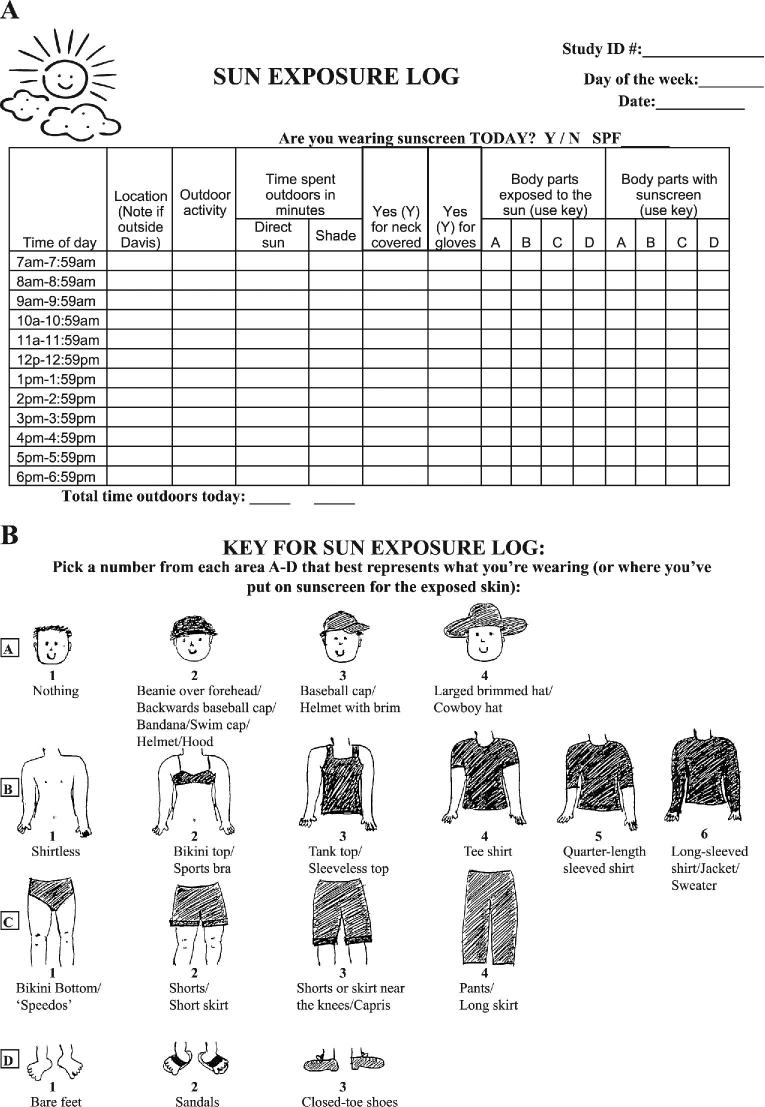
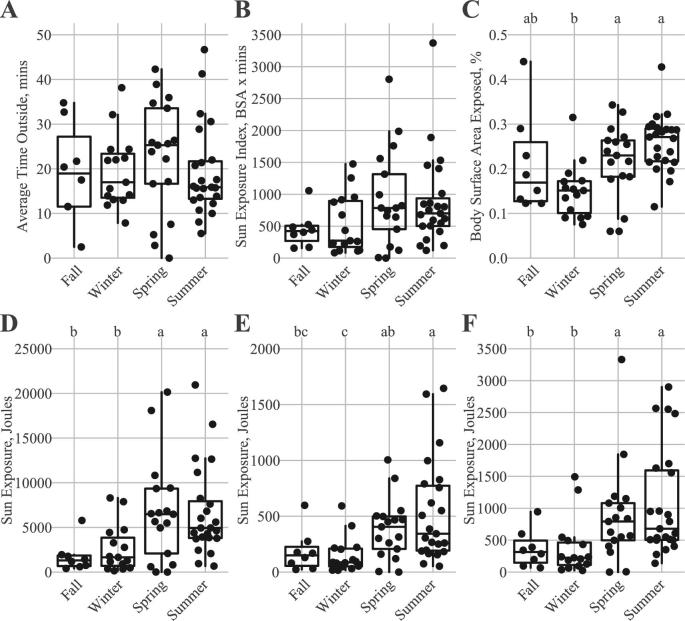
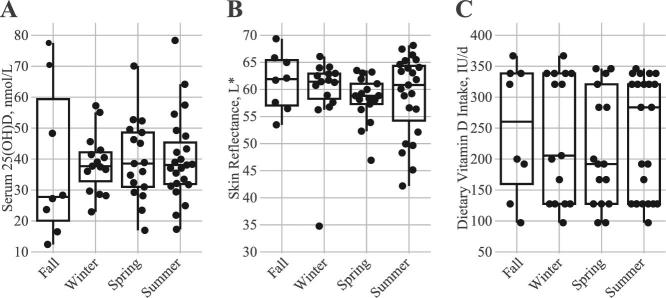
Methods: This study was a secondary analysis of a 15-wk controlled feeding study investigating the effects of dairy consumption on body composition. Information regarding sun exposure, including day, hour, time outside, and clothing, were self-assessed in sun exposure diaries. Personal sun exposure energy (joules) was assessed by downloading time-specific ultraviolet B energy data from climate stations. Skin reflectance was measured using a Minolta 2500d spectrophotometer. Dietary intake of vitamin D was known. Serum 25(OH)D concentration was measured by radioimmunoassay. Body composition was determined from whole-body dual energy x-ray absorptiometry and computed tomography scans.
Results: Sun exposure was positively related to serum 25(OH)D (r = 0.26; P ≤ 0.05) and inversely related to total fat mass, android fat, and BMI (r = -0.25, -0.30, and -0.32, respectively). The modified Hall model significantly overestimated serum 25(OH)D in overweight and obese adults by 27.33-80.98 nmol/L, depending on the sun exposure calculation. A new regression model was developed for overweight and obese persons that explained 29.1% of the variance in postintervention 25(OH)D concentrations and included sun exposure, skin reflectance, total fat mass, total lean mass, and intra-abdominal adipose tissue as predictors.
Conclusion: Major determinants of serum 25(OH)D concentration in healthy overweight and obese individuals include sun exposure, skin reflectance, and adiposity. Addition of adiposity terms to the prior model significantly improved predictive ability in overweight and obese men and women. (clinicaltrials.gov: NCT00858312).
Keywords: body composition; obesity; skin reflectance; sun exposure; vitamin D.
Figures
Similar articles
-
Determinants of vitamin D status among overweight and obese Puerto Rican adults.Ann Nutr Metab. 2012;60(1):35-43. doi: 10.1159/000335282. Epub 2012 Jan 4. Ann Nutr Metab. 2012. PMID: 22222318 Free PMC article.
-
Maternal excess adiposity and serum 25-hydroxyvitamin D < 50 nmol/L are associated with elevated whole body fat mass in healthy breastfed neonates.BMC Pregnancy Childbirth. 2022 Jan 29;22(1):83. doi: 10.1186/s12884-022-04403-w. BMC Pregnancy Childbirth. 2022. PMID: 35093026 Free PMC article.
-
Vitamin D intake needed to maintain target serum 25-hydroxyvitamin D concentrations in participants with low sun exposure and dark skin pigmentation is substantially higher than current recommendations.J Nutr. 2010 Mar;140(3):542-50. doi: 10.3945/jn.109.115253. Epub 2010 Jan 6. J Nutr. 2010. PMID: 20053937 Free PMC article.
-
Vitamin D and obesity: current perspectives and future directions.Proc Nutr Soc. 2015 May;74(2):115-24. doi: 10.1017/S0029665114001578. Epub 2014 Oct 31. Proc Nutr Soc. 2015. PMID: 25359323 Review.
-
Relative importance of summer sun exposure, vitamin D intake, and genes to vitamin D status in Dutch older adults: The B-PROOF study.J Steroid Biochem Mol Biol. 2016 Nov;164:168-176. doi: 10.1016/j.jsbmb.2015.08.008. Epub 2015 Aug 11. J Steroid Biochem Mol Biol. 2016. PMID: 26275945 Review.
Cited by
-
Implications of Vitamin D Research in Chickens can Advance Human Nutrition and Perspectives for the Future.Curr Dev Nutr. 2021 Feb 25;5(5):nzab018. doi: 10.1093/cdn/nzab018. eCollection 2021 May. Curr Dev Nutr. 2021. PMID: 33977215 Free PMC article.
-
Factors associated with vitamin D deficiency in health care workers exposed to SARS-CoV-2: a cross-sectional study.Front Nutr. 2024 Jul 24;11:1440185. doi: 10.3389/fnut.2024.1440185. eCollection 2024. Front Nutr. 2024. PMID: 39114123 Free PMC article.
-
Association between Body Fatness and Vitamin D3 Status in a Postmenopausal Population.Nutrients. 2020 Feb 29;12(3):667. doi: 10.3390/nu12030667. Nutrients. 2020. PMID: 32121398 Free PMC article.
-
Vitamin D Enhancement of Adipose Biology: Implications on Obesity-Associated Cardiometabolic Diseases.Nutrients. 2025 Feb 6;17(3):586. doi: 10.3390/nu17030586. Nutrients. 2025. PMID: 39940444 Free PMC article. Review.
-
Circulating levels of free 25(OH)D increase at the onset of rheumatoid arthritis.PLoS One. 2019 Sep 26;14(9):e0219109. doi: 10.1371/journal.pone.0219109. eCollection 2019. PLoS One. 2019. PMID: 31557191 Free PMC article.
References
-
- Di Angelantonio E, Bhupathiraju SN, Wormser D, Gao P, Kaptoge S, de Gonzalez AB, Cairns BJ, Huxley R, Jackson CL, Joshy G et al. .. Body-mass index and all-cause mortality: individual-participant-data meta-analysis of 239 prospective studies in four continents. Lancet 2016;388:776–86. - PMC - PubMed
-
- Samuel L, Borrell LN.. The effect of body mass index on optimal vitamin D status in U.S. adults: The National Health and Nutrition Examination Survey 2001–2006. Ann Epidemiol 2013;23:409–14. - PubMed
-
- Al-khalidi B, Kimball SM, Kuk JL, Ardern CI. Metabolically healthy obesity, vitamin D, and all-cause and cardiometabolic mortality risk in NHANES III. Clin Nutr 2019;38:820–8. - PubMed
