

Centriolar satellites are acentriolar assemblies of centrosomal proteins
- PMID: 31304626
- PMCID: PMC6627235
- DOI: 10.15252/embj.2018101082
Centriolar satellites are acentriolar assemblies of centrosomal proteins
Abstract
Centrioles are core structural elements of both centrosomes and cilia. Although cytoplasmic granules called centriolar satellites have been observed around these structures, lack of a comprehensive inventory of satellite proteins impedes our understanding of their ancestry. To address this, we performed mass spectrometry (MS)-based proteome profiling of centriolar satellites obtained by affinity purification of their key constituent, PCM1, from sucrose gradient fractions. We defined an interactome consisting of 223 proteins, which showed striking enrichment in centrosome components. The proteome also contained new structural and regulatory factors with roles in ciliogenesis. Quantitative MS on whole-cell and centriolar satellite proteomes of acentriolar cells was performed to reveal dependencies of satellite composition on intact centrosomes. Although most components remained associated with PCM1 in acentriolar cells, reduced cytoplasmic and satellite levels were observed for a subset of centrosomal proteins. These results demonstrate that centriolar satellites and centrosomes form independently but share a substantial fraction of their proteomes. Dynamic exchange of proteins between these organelles could facilitate their adaptation to changing cellular environments during development, stress response and tissue homeostasis.
Keywords: centrioles; centrosome; composition; proteome; satellites.
© 2019 The Authors. Published under the terms of the CC BY 4.0 license.
Conflict of interest statement
The authors declare that they have no conflict of interest.
Figures
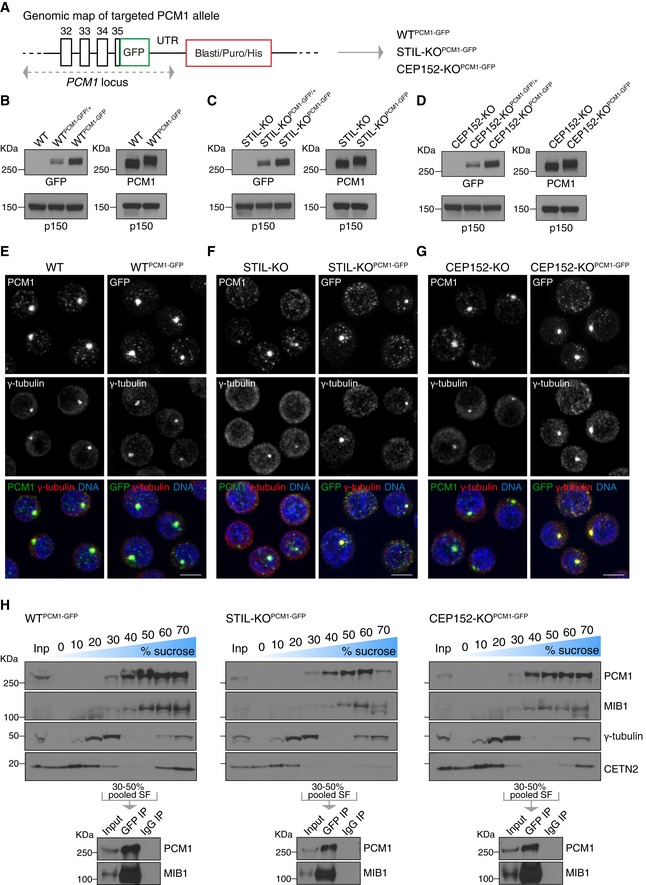
- A
Targeting of GFP into the PCM1 locus, at the C‐terminus. GFP was biallelically inserted in‐frame with PCM1 into WT, STIL‐KO and CEP152‐KO cells to obtain WTPCM1‐GFP, STIL‐KOPCM1‐GFP and CEP152‐KOPCM1‐GFP cells.
- B–D
Western blots of cytoplasmic extracts from WT (B), STIL‐KO (C) and CEP152‐KO (D) DT40 cells, probed with antibodies against GFP, PCM1 and the loading control, p150. Clones carrying mono‐ or biallelically GFP‐tagged PCM1 alleles are denoted PCM1‐GFP/+ and PCM1‐GFP, respectively. Note the expected shift in PCM1 size in PCM1‐GFP‐targeted cells.
- E–G
PCM1‐GFP phenocopies localisation pattern of untagged PCM1 in WT (E), STIL‐KO (F) and CEP152‐KO (G) cells. Representative immunofluorescence images of WT and WTPCM1‐GFP cells, STIL‐KO and STIL‐KOPCM1‐GFP and, CEP152‐KO and CEP152‐KOPCM1‐GFP cells co‐stained with antibodies against PCM1 (green) and γ‐tubulin (red) or GFP (green) and γ‐tubulin (red). DNA is in blue. Images correspond to maximum intensity projections of confocal micrographs. Scale bars: 5 μm.
- H
Upper panels depict Western blot analysis of PCM1, MIB1, γ‐tubulin and centrin 2 (CETN2) sedimentation on 10–70% sucrose gradient of WTPCM1‐GFP (left panel), STIL‐KOPCM1‐GFP (middle panel) and CEP152‐KOPCM1‐GFP (right panel) cells. 1% of the input and 5% of each sucrose fraction (SF) were loaded. 30–50% SF were pooled for immunoprecipitation with GFP antibody (GFP IP) or mouse IgG (IgG IP), and corresponding Western blots (lower panels) were probed with antibodies against PCM1 and MIB1.

Diagram showing the GFP construct used to target the chicken PCM1 locus at the C‐terminus on both alleles, by homologous recombination. Highlighted the Sal1 and BamH1 sites used for restriction digestion to clone the LA (Left Arm) and the RA (Right Arm) and to replace the resistance cassette. Clones were screened for antibiotic resistance genes blasticidin (Blasti), puromycin (Puro) or Histidinol (His). LoxP sites flanking the resistance cassette are represented by red triangles. The dashed lines indicate the sites of recombination and integration in the PCM1 locus. Confirmation of targeting was carried out by Western blotting, as shown in Fig 1B–D.
Representative immunofluorescence images of cell lines with genotypes as indicated, treated with both nocodazole (2 μg/ml) and cytochalasin‐B (1 μg/ml). DMSO‐treated cells were used as a control (DMSO, upper panels). Treatments were carried out for 2 h, and cells were co‐stained with antibodies against GFP (green) and γ‐tubulin (red). DNA is in blue. Images correspond to maximum intensity projections of confocal micrographs. Asterisks mark cells with dispersed satellites. Note that drug treatment leads to an increase in large and a decrease in small satellite granules in all three genotypes, but the effects are more prominent in acentriolar than in WT cells. Scale bars: 5 μm.
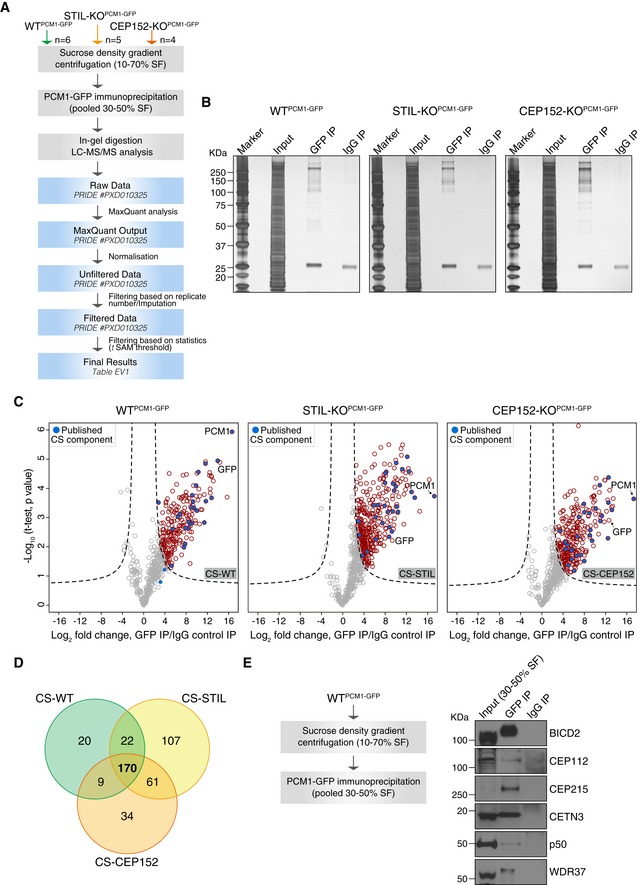
Experimental workflow of satellite isolation and proteomic analysis. Number of biological replicates per genotype is indicated. SF: sucrose fraction.
Representative silver‐stained gels of GFP or IgG immunoprecipitation (IP) from pooled 30–50% sucrose fractions of WTPCM1‐GFP, STIL‐KOPCM1‐GFP and CEP152‐KOPCM1‐GFP cells. 0.5% of input and 5% of the IP samples were loaded.
Volcano plots showing quantitative label‐free mass spectrometry data from WTPCM1‐GFP (left panel), STIL‐KOPCM1‐GFP (middle panel) and CEP152‐KOPCM1‐GFP (right panel) cell lines. Red circles correspond to hits significantly enriched in GFP vs. IgG pull‐downs. Previously described satellite components, including PCM1, are shown in blue. Data were filtered to retain proteins detected in a minimum of 4/6 (CS‐WT), 3/5 (CS‐STIL) and 3/4 (CS‐CEP152) replicates.
Venn diagram of the number of candidates identified in CS‐WT, CS‐STIL and CS‐CEP152. Multiple gene products associated with the same gene symbol have been collapsed into one.
PCM1 co‐immunoprecipitates with satellite candidates in DT40 cells. Workflow is shown on the left. Western blots on right depict immunoprecipitation performed using a GFP antibody (GFP IP) or mouse IgG (IgG IP) on pooled 30–50% sucrose fractions from WTPCM1‐GFP cells. Blots were probed with antibodies as indicated. 1% of the input and 5% of the pull‐down samples were loaded.
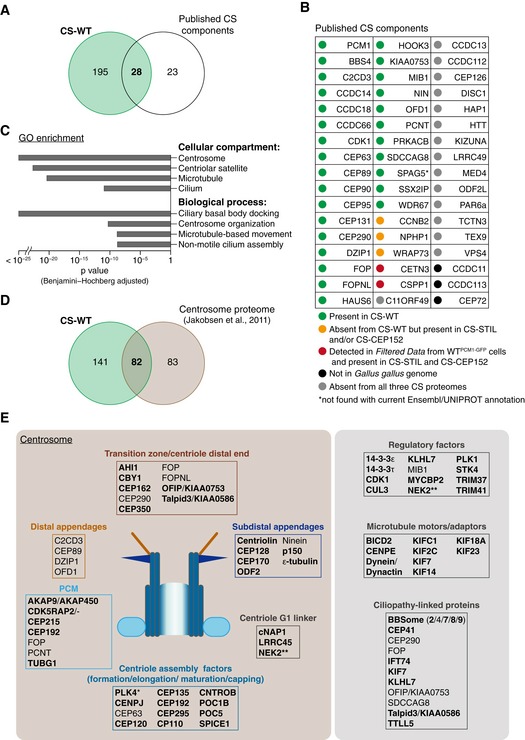
Venn diagram of total protein numbers from CS‐WT and known satellite components. Note that this and all subsequent analyses were performed on human orthologues of the chicken proteins from CS‐WT.
Table depicts previously reported satellite components and their status in CS‐WT. Note that the current Ensembl/UNIPROT annotation fails to detect SPAG5.
Gene Ontology (GO) enrichment analysis performed on CS‐WT. Selected terms with high significance are shown with the corresponding Benjamini–Hochberg adjusted P values.
Venn diagram of total protein numbers from CS‐WT and the comprehensive proteomic dataset of centrosomes as reported in Jakobsen et al (2011).
Schematics depict a selection of known and newly identified (bold) satellite candidates (from CS‐WT) and the centrosomal substructures and/or pathways they are implicated in. PLK4 is marked with an asterisk, as it was detected only in CS‐STIL. Several ciliopathy‐associated proteins are found in CS‐WT including newly identified candidates (bold). NEK2 is marked with two asterisks, as it was also shown to partially co‐localise with PCM1 by Hames et al (2005).
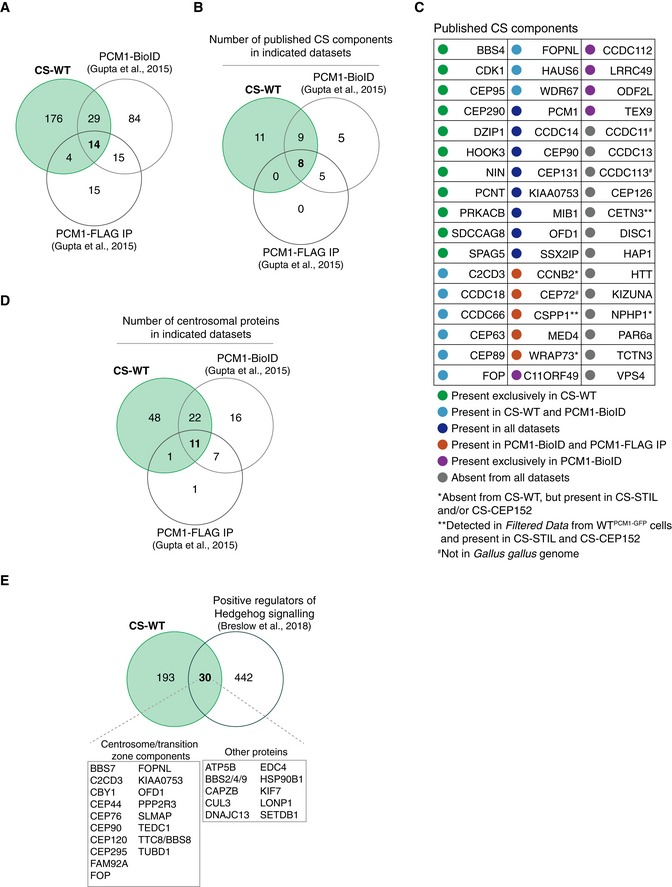
Venn diagram showing the number of proteins identified in three datasets: CS‐WT, PCM1‐BioID (Gupta et al, 2015) and PCM1‐FLAG IP (Gupta et al, 2015). Note that this and all subsequent analyses were performed on human orthologues of the chicken proteins from CS‐WT.
Venn diagrams showing the number of published CS components (illustrated in the table in C) detected in each of the indicated datasets.
Table depicts previously reported CS components and their detection in the indicated datasets.
Venn diagram showing the number of centrosomal proteins based on the human centrosome proteome dataset (Jakobsen et al, 2011) detected in each of the indicated datasets. Note that the majority of the proteins detected in both CS‐WT and PCM1‐BioID are centrosomal proteins (33/43).
Venn diagram showing the overlap between proteins identified in CS‐WT and in a functional screen for positive regulators of Hedgehog signalling (Breslow et al, 2018).
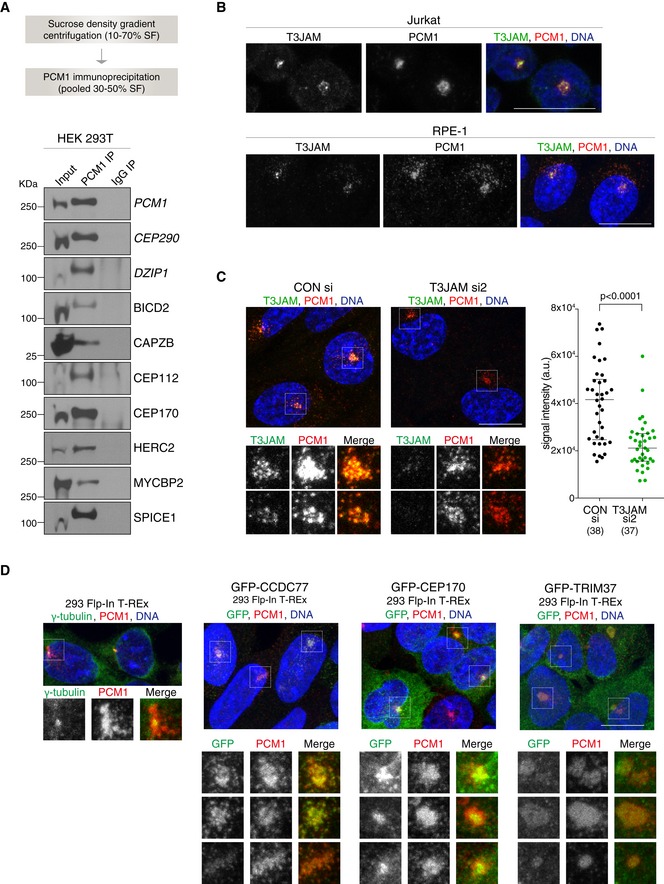
Workflow of satellite isolation from HEK293T cells is shown on top. Western blots below depict immunoprecipitation performed using a PCM1 antibody (PCM1 IP) or mouse IgG (IgG IP) on pooled 30–50% sucrose fractions (input). Blots were probed with antibodies against satellite candidates with CEP290 and DZIP1 serving as positive controls (shown in italic). 1% of the input and 5% of the pull‐down samples were loaded.
Representative immunofluorescence images of T3JAM localisation in Jurkat (top panels) and RPE‐1 (bottom panels) cells. Cells were co‐stained with antibodies against PCM1 (red) and T3JAM (green). DNA is in blue. Images correspond to maximum intensity projections of confocal micrographs. Scale bar: 10 μm. Immunofluorescence images of further candidates are shown in Fig EV3A.
Representative immunofluorescence images of RPE‐1 cells treated with control (CONsi) or T3JAM‐targeting (T3JAMsi2) siRNAs. Satellites are shown at high magnification below. Cells were co‐stained with antibodies against PCM1 (red) and T3JAM (green). DNA is in blue. Images correspond to maximum intensity projections of confocal micrographs. Scale bars: 10 μm. Graph on right depicts T3JAM total signal intensities measured across a circle (d = 8 μm) encompassing PCM1 signal. Medians and interquartile ranges are indicated; the number of cells analysed is reported in parentheses. P values were obtained by Mann–Whitney U test.
Representative immunofluorescence images of parental 293 Flp‐In T‐REx cells and cells expressing GFP fusions of satellite candidates. Satellites are shown at high magnification below. Cells were co‐stained with antibodies against GFP (green) and PCM1 (red) following treatment with 4 μg/ml tetracycline (see Western blots in Appendix Fig S2). DNA is in blue. Images correspond to the maximum intensity projection of the confocal micrograph. Note smooth appearance of PCM1 signal upon TRIM37 overexpression. Scale bars: 10 μm.
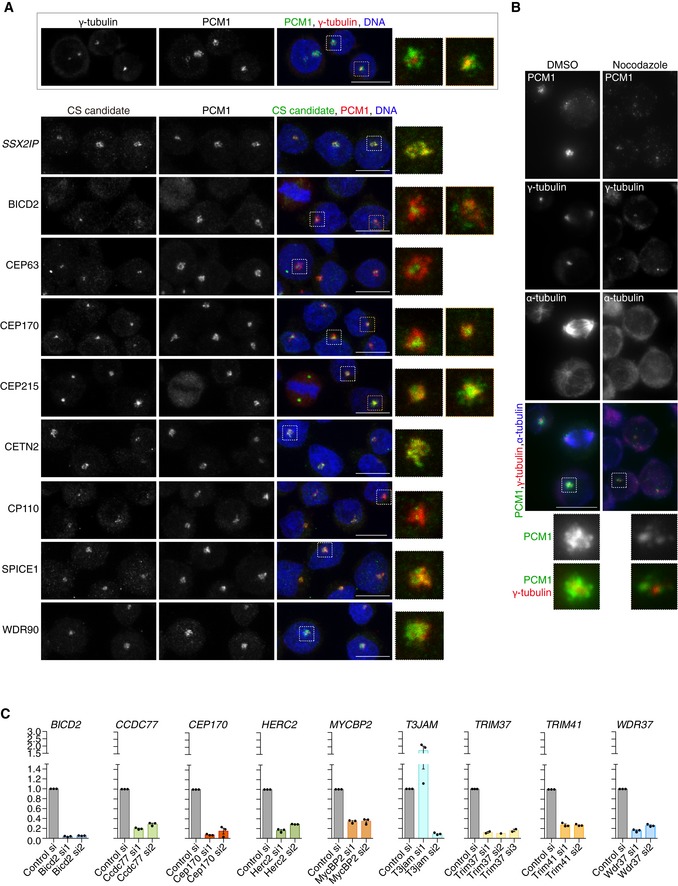
Representative immunofluorescence images of Jurkat cells co‐stained with antibodies against selected new CS candidates (green) and PCM1 (red). SSX2IP, a known CS component, is shown as positive control. The framed panel at the bottom illustrates the relative distributions of the centrosomal marker γ‐tubulin (red) and the CS protein PCM1 (green) in Jurkat cells. DNA is in blue. Images correspond to maximum intensity projections of confocal micrographs. High magnification images are included to aid visualisation of framed areas. Scale bars: 5 μm.
Representative immunofluorescence images of Jurkat cells mock‐treated with DMSO or incubated with nocodazole (2 μg/ml) to depolymerise microtubules. Cells were co‐stained with antibodies against PCM1 (green), γ‐tubulin (red) and α‐tubulin (blue). Nocodazole reduces PCM1 signal in the pericentrosomal region. High magnification images are included to aid visualisation of framed areas and correspond to framed areas. Scale bar: 5 μm.
Knock‐down efficiency of siRNAs assessed by qPCR. The relative expression of each candidate upon siRNA treatment was assessed by qPCR and shown relative to cells treated with a control siRNA. Each datapoint represents a biological replicate. Note that T3JAMsi1 enhances rather than reduces mRNA expression. Bar graphs show mean ± SE.
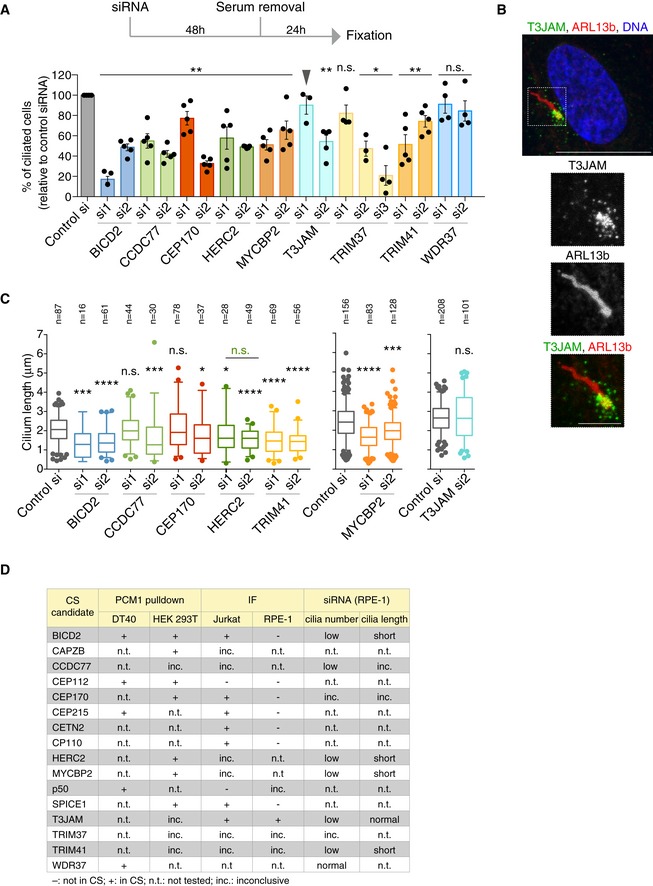
Evaluating the roles of satellite candidates in ciliogenesis by siRNA‐mediated depletion. Experimental timeline is depicted on top with graph below showing the percentage of ciliated cells relative to control siRNA (si) treatment. Datapoints correspond to biological replicates (n = 3–5 per siRNA, 100–200 cells scored per experiment; for HERC2 si, 60–100 due to reduced viability). P values were obtained by Mann–Whitney U test and are relative to control siRNA (*P ≤ 0.05; **P ≤ 0.01; n.s.: not significant). Note that T3JAMsi1 failed to deplete T3JAM (arrowhead) according to Fig EV3C. Bar chart depicts mean percentage ± SE.
Representative immunofluorescence image shows T3JAM localisation at the base of the primary cilium in serum‐starved RPE‐1 cells. Cells were co‐stained with antibodies against T3JAM (green) and the ARL13b (red). DNA is in blue. The image corresponds to maximum intensity projection of the confocal micrograph. Scale bar: 10 μm. Scale bar on cilia zoom in: 3 μm.
Cilia length was determined in cells depleted of candidate satellite components. Datapoints were collected from two biological replicates; total number of cilia scored is indicated. In the plots, boxes represent interquartile ranges, horizontal lines the medians, and whiskers the 5th–95th percentiles. P values were obtained by Mann–Whitney U test (*P ≤ 0.05; ***P ≤ 0.001; ****P ≤ 0.0001).
Table provides an overview of validation and functional assays performed on satellite candidates. IF: immunofluorescence. For proteins where antibody epitope showed high conservation between human and chicken, the antibody was tested on DT40 cells. Inconclusive (inc.) refers to non‐specific bands on Western blots or diffuse staining in IF.
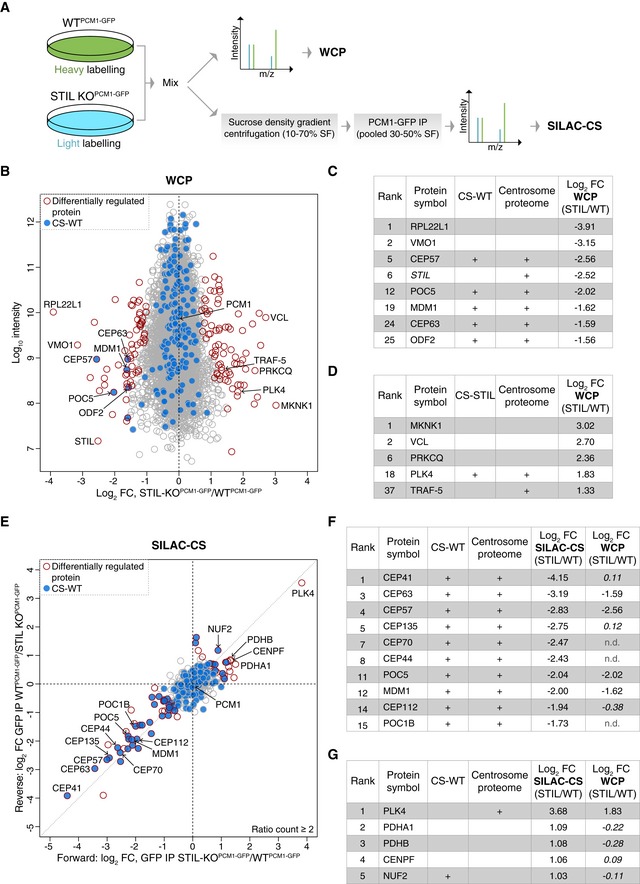
Experimental workflow of SILAC‐based MS analysis. Note that differentially labelled cells were mixed prior to the multistep CS purification process to minimise variability in sample preparation.
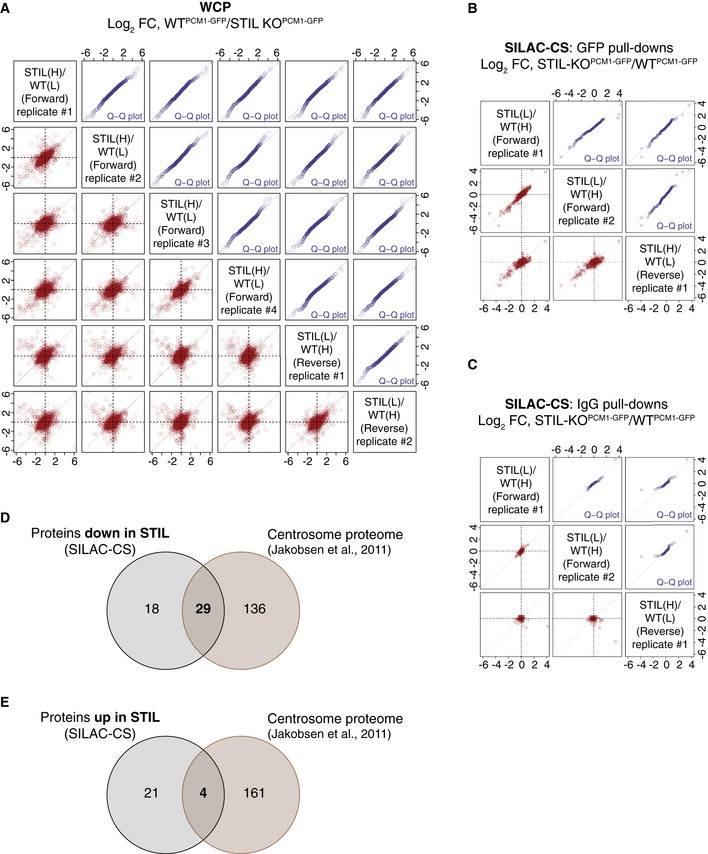
Comparison of whole‐cell proteomes (WCP) of differentially labelled WTPCM1‐GFP and STIL‐KOPCM1‐GFP cells. Scatterplot shows the fold change in SILAC protein ratios. Proteins with significant changes in abundance between WTPCM1‐GFP and STIL‐KOPCM1‐GFP cells are shown as red circles [determined using Significance B with protein ratios stratified according to protein intensity (Cox & Mann, 2008)], whereas proteins previously identified in CS‐WT are in blue.
Table shows list of proteins reduced in WCP‐STIL, ranked according to fold change. In addition to the two proteins with the greatest log2 fold change, all significantly down‐regulated centrosomal and/or satellite proteins are included. Note that the “re‐quantify” function of MaxQuant enabled assignment of SILAC ratios to proteins with infinity ratios (i.e. STIL in STIL‐KO).
Table shows list of proteins elevated in WCP‐STIL, ranked according to fold change. PLK4 is the most significantly up‐regulated centrosomal protein.
Comparison of satellite proteomes isolated from differentially labelled WTPCM1‐GFP and STIL‐KOPCM1‐GFP cells. Scatterplot shows the fold change in SILAC protein ratios. The x‐axis corresponds to the forward, whereas the y‐axis to the reverse experiments. Proteins with significant changes in abundance between satellite isolated from WTPCM1‐GFP and STIL‐KOPCM1‐GFP cells are shown as red circles [obtained by Significance A parameter (Cox & Mann, 2008)], whereas those previously identified in CS‐WT are in blue.
Table shows list of proteins reduced in SILAC‐CS‐STIL and their corresponding fold change in the WCP. They are ranked according to fold change. Changes that are not significant are depicted in italics; n.d.: not detected.
Table shows list of proteins elevated in SILAC‐CS‐STIL and their corresponding fold change in the WCP. They are ranked according to fold change. Changes that are not significant are depicted in italics.
- A
Reproducibility of SILAC‐WCP experiments.
- B, C
Reproducibility of SILAC‐CS experiments. Scatterplots (in red) showing the reproducibility and quantile–quantile plots (in blue) showing similar ratio distribution between the replicates, for the GFP pull‐downs (B) and the IgG CT pull‐downs (C). Protein ratios of the reverse experiment have been inverted.
- D
Venn diagram showing the overlap between the proteins down‐regulated in SILAC‐CS‐STIL and the centrosome proteome dataset (Jakobsen et al, 2011).
- E
Venn diagram showing the overlap between the proteins up‐regulated in SILAC‐CS‐STIL and the centrosome proteome dataset (Jakobsen et al, 2011). Note that centrosomal proteins are under‐represented among the up‐regulated proteins.
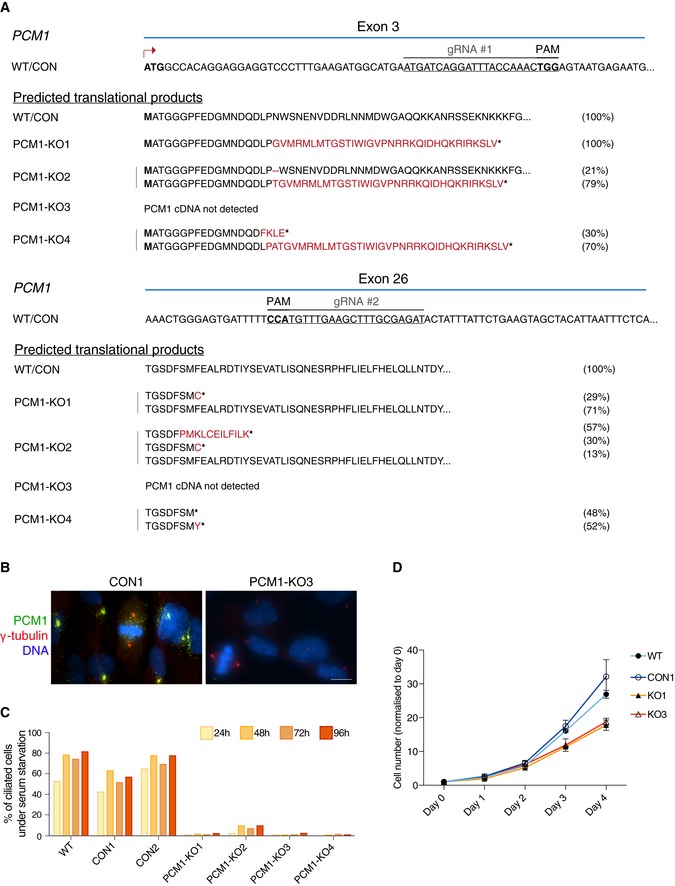
CRISPR/Cas9 strategy to generate PCM‐deficient cells. The PAM sequences are highlighted in bold. Target sequences in exons 3 and 26 are shown. Below, predicted translational products from all the sequenced variants are listed. Briefly, PCM1 variants were identified by amplifying and sequencing the regions of PCM1 cDNA targeted by the gRNAs. Amino acids deleted are represented by the dash symbol, those divergent from the control sequence are highlighted in red, whereas stop of translation is represented by the asterisk. For each clone, 10–25 bacterial colonies were sequenced. The percentage of each transcript variant/translational product is indicated at the right of each panel. For PCM1‐KO 3, the PCM1 cDNA sequence was not detected.
Representative immunofluorescence images of PCM1 control (CON 1) and KO (KO 3) cells co‐stained with antibodies against PCM1 (green) and γ‐tubulin (red). DNA is in blue. Images correspond to maximum intensity projections of wide‐field micrograph. Scale bar: 10 μm.
Bar chart depicts the percentage of ciliated cells in RPE‐1 WT cells, control (CON) and PCM1‐KO clones, after serum starvation. Cells were scored at 24, 48, 72 and 96 h after serum starvation. 200–400 cells were counted for each time‐point. Data shown corresponds to a single experiment.
Graph showing the rate of cell growth in the various genotypes. Numbers were normalised to day 0. WT: parental cell line; CON: control clone; KO: PCM1‐KO clones. n = 2 replicates are plotted as mean ± SD.
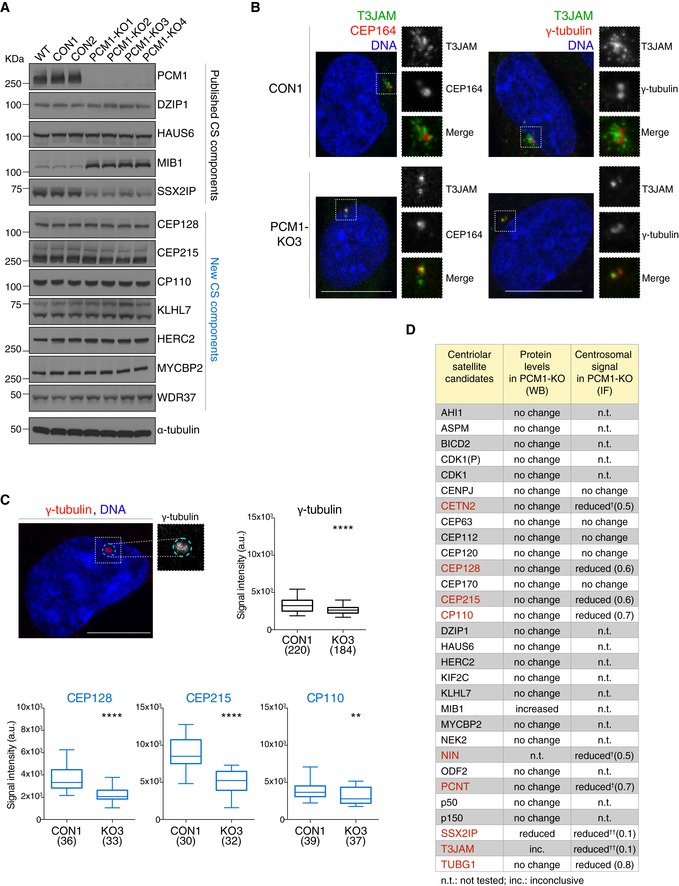
Western blots show levels of known satellite components and satellite candidates (from CS‐WT) in control (CON) and PCM1 knock‐out (KO) RPE‐1 cell clones. Western blots of further candidates are included in Appendix Fig S3. WT corresponds to parental RPE‐1 cells. α‐tubulin served as loading control.
Representative immunofluorescence images of T3JAM localisation in control (CON) and PCM1‐KO (KO3) cells. Higher magnifications of framed areas are shown in right panels. Cells were co‐stained with antibodies against T3JAM (green) and CEP164 (red), or T3JAM (green) and γ‐tubulin (red), as indicated. DNA is in blue. Images correspond to the maximum intensity projection of the confocal micrograph. Scale bar: 10 μm.
Quantification of centrosomal enrichment of satellite candidates in PCM1‐KO cells. As illustrated by the dotted line shown in cyan in the representative confocal image, signal intensities were measured on maximum intensity projection images within a circle encompassing the centrosome as defined by γ‐tubulin‐positive staining (γ‐tubulin is shown in red, DNA in blue). Box plots show total centrosomal signal intensities of satellite candidates (CEP128, CEP215 and CP110) in control (CON1) and PCM1‐KO (KO3) cells. Boxes represent interquartile ranges, lines in boxes the medians, and whiskers indicate the 5th–95th percentiles. P values were obtained by the Mann–Whitney U test (**P ≤ 0.01; ****P ≤ 0.0001; n.s.: not significant); the number of cells analysed is reported in parentheses.
Table summarises protein levels and centrosomal signals of satellite candidates in PCM1‐KO cells (primary data in (A), (B) and Appendix Fig S3). Proteins with change in centrosomal signal (P value of 0.01 or less, Mann–Whitney test) are shown in red. Numbers in parentheses depict fold changes in centrosomal signal intensities. †Satellite components centrin 3 (CETN3), ninein (NIN) and pericentrin (PCNT) were included as positive controls (Dammermann & Merdes, 2002). ††For proteins with prominent satellite localisation (SSX2IP and T3JAM), reduction in centrosomal signal in PCM1‐KO may correspond to loss of pericentrosomal satellites.
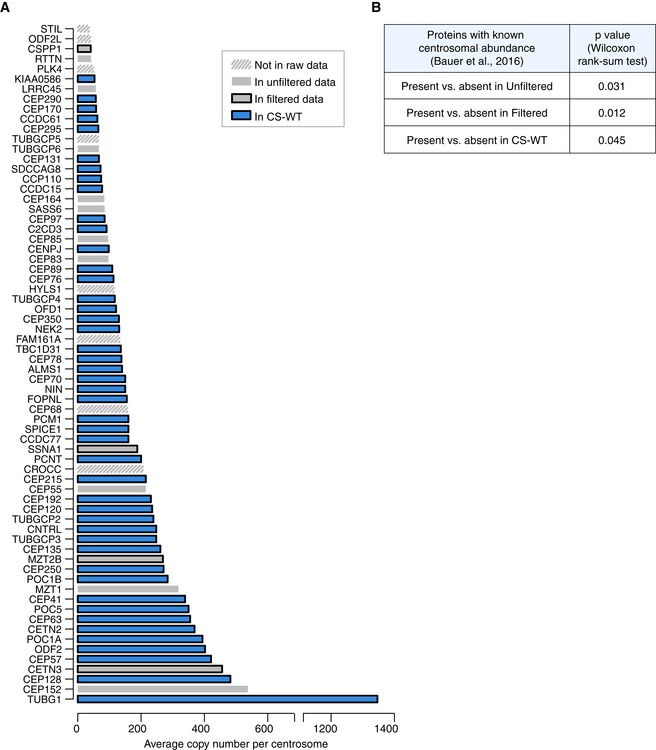
Graph depicts relative protein abundance in centrosome preparations from KE37 cells (adapted from Fig 3, Bauer et al, 2016) and their status in our datasets. The categories Unfiltered and Filtered Data and CS‐WT are defined in Fig 2A. Proteins absent from the chicken genome have been removed. See also Table EV4.
To assay correlation between centrosomal abundance of proteins (from Bauer et al, 2016) and their presence in our satellite proteome datasets, centrosomal proteins were categorised based on their detection in our satellite proteome datasets. For each category (presence vs. absence), the abundance ranks of protein copy numbers were then compared using a two‐sided Wilcoxon rank‐sum test and the corresponding P values are depicted in the table.
Similar articles
-
Spatial and proteomic profiling reveals centrosome-independent features of centriolar satellites.EMBO J. 2019 Jul 15;38(14):e101109. doi: 10.15252/embj.2018101109. Epub 2019 Jun 3. EMBO J. 2019. PMID: 31304627 Free PMC article.
-
Deubiquitylase USP9X maintains centriolar satellite integrity by stabilizing pericentriolar material 1 protein.J Cell Sci. 2019 Jan 22;132(2):jcs221663. doi: 10.1242/jcs.221663. J Cell Sci. 2019. PMID: 30584065 Free PMC article.
-
A non-canonical function of Plk4 in centriolar satellite integrity and ciliogenesis through PCM1 phosphorylation.EMBO Rep. 2016 Mar;17(3):326-37. doi: 10.15252/embr.201541432. Epub 2016 Jan 11. EMBO Rep. 2016. PMID: 26755742 Free PMC article.
-
Centriolar satellite biogenesis and function in vertebrate cells.J Cell Sci. 2020 Jan 2;133(1):jcs239566. doi: 10.1242/jcs.239566. J Cell Sci. 2020. PMID: 31896603 Review.
-
Navigating centriolar satellites: the role of PCM1 in cellular and organismal processes.FEBS J. 2025 Feb;292(4):688-708. doi: 10.1111/febs.17194. Epub 2024 Jun 2. FEBS J. 2025. PMID: 38825736 Free PMC article. Review.
Cited by
-
Coordination of IFT20 With Other IFT Components Is Required for Ciliogenesis.J Clin Lab Anal. 2025 May;39(9):e70000. doi: 10.1002/jcla.70000. Epub 2025 Apr 7. J Clin Lab Anal. 2025. PMID: 40192002 Free PMC article.
-
Centrosomal and Non-centrosomal Functions Emerged through Eliminating Centrosomes.Cell Struct Funct. 2020 May 23;45(1):57-64. doi: 10.1247/csf.20007. Epub 2020 Apr 9. Cell Struct Funct. 2020. PMID: 32269206 Free PMC article. Review.
-
A Proximity Mapping Journey into the Biology of the Mammalian Centrosome/Cilium Complex.Cells. 2020 Jun 3;9(6):1390. doi: 10.3390/cells9061390. Cells. 2020. PMID: 32503249 Free PMC article. Review.
-
The centrosomal protein 131 participates in the regulation of mitochondrial apoptosis.Commun Biol. 2023 Dec 15;6(1):1271. doi: 10.1038/s42003-023-05676-3. Commun Biol. 2023. PMID: 38102401 Free PMC article.
-
EHD1 promotes CP110 ubiquitination by centriolar satellite delivery of HERC2 to the mother centriole.EMBO Rep. 2023 Jun 5;24(6):e56317. doi: 10.15252/embr.202256317. Epub 2023 Apr 19. EMBO Rep. 2023. PMID: 37074924 Free PMC article.
References
-
- Andersen JS, Wilkinson CJ, Mayor T, Mortensen P, Nigg EA, Mann M (2003) Proteomic characterization of the human centrosome by protein correlation profiling. Nature 426: 570–574 - PubMed
Publication types
MeSH terms
Substances
Grants and funding
LinkOut - more resources
Full Text Sources
Research Materials
