Spatial and proteomic profiling reveals centrosome-independent features of centriolar satellites
- PMID: 31304627
- PMCID: PMC6627244
- DOI: 10.15252/embj.2018101109
Spatial and proteomic profiling reveals centrosome-independent features of centriolar satellites
Abstract
Centriolar satellites are small electron-dense granules that cluster in the vicinity of centrosomes. Satellites have been implicated in multiple critical cellular functions including centriole duplication, centrosome maturation, and ciliogenesis, but their precise composition and assembly properties have remained poorly explored. Here, we perform in vivo proximity-dependent biotin identification (BioID) on 22 human satellite proteins, to identify 2,113 high-confidence interactions among 660 unique polypeptides. Mining this network, we validate six additional satellite components. Analysis of the satellite interactome, combined with subdiffraction imaging, reveals the existence of multiple unique microscopically resolvable satellite populations that display distinct protein interaction profiles. We further show that loss of satellites in PCM1-depleted cells results in a dramatic change in the satellite interaction landscape. Finally, we demonstrate that satellite composition is largely unaffected by centriole depletion or disruption of microtubules, indicating that satellite assembly is centrosome-independent. Together, our work offers the first systematic spatial and proteomic profiling of human centriolar satellites and paves the way for future studies aimed at better understanding the biogenesis and function(s) of these enigmatic structures.
Keywords: BioID; centrinone; centriolar satellites; centrosome; proteomics.
© 2019 The Authors. Published under the terms of the CC BY NC ND 4.0 license.
Conflict of interest statement
The authors declare that they have no conflict of interest.
Figures

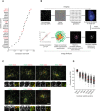
Schematic highlighting the bait proteins subjected to BioID in this analysis (see Table EV1 for more details).
Flp‐In T‐REx 293 cells stably expressing Tet‐inducible BirA*‐FLAG‐tagged TBC1D31 were fixed 24 h after incubation with Tet and biotin. Cells were stained with antibodies against FLAG, PCM1 (green), and Alexa Fluor 594‐coupled streptavidin for biotinylated proteins (red), and DAPI for nucleus. Scale bar, 3 μm (see Fig EV1A for other baits).
Self‐organized network of the satellite bait–prey interactome. Highlighted is a network “core” region (dashed circle, zoomed image of the core protein population on the right) which includes prey proteins interacting with > 11 (i.e., > 50%) satellite bait polypeptides, and a peripheral ring (purple ring) encompassing the bait proteins that associate with preys in additional cellular compartments (GO terms associated with some peripheral prey groups are indicated; see Table EV3 for details). PxI, proximity interaction. Prey proteins are color‐coded as indicated. Please note that except for PCM1, which is known to exclusively localize to the centriolar satellites, the rest of the proteins labeled in yellow are known to localize to both satellites and centrioles. Preys marked in orange are known to localize to centrosomes (centrioles and/or pericentriolar material) and not to centriolar satellites, as of the date of this study.
Enriched GO categories or gene groups overlaid on thumbnails of the network topology map (see Table EV3 for details).
Venn diagram comparing the number of high‐confidence hits found in this study vs. previous publications.
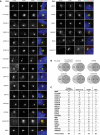
Immunofluorescence (IF) analysis of Flp‐In T‐REx 293 cells stably expressing the indicated Tet‐inducible BirA*‐FLAG or FLAG‐BirA*‐tagged proteins (see Table EV1 for details). Cells were fixed 24 h after adding Tet and biotin, and stained with the indicated antibodies and Alexa Fluor 594‐coupled streptavidin and DAPI. Scale bar, 3 μm.
Venn diagrams comparing the number of high‐confidence hits identified in this study (light gray) vs. hits from Firat‐Karalar et al and Conkar et al for all baits (top left) or individual satellite components, as indicated (details in Table EV4).
Comparison of the number of centriolar satellite preys found in our study with the Gupta et al and the Centrosome and Cilia Database (CCDB) reported in the previous proteomics studies. The column on the right indicates the number of the new preys identified here for the given bait protein that were not previously reported.
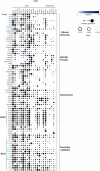

Molecular heat map of the satellite network based on the number of baits that interact with each prey (i.e., indegree number). Number of preys in each color grouping shown at right. Red circles represent the satellites identified in this study.
Interactome “dot plot” for the 11 prey proteins characterized in (C). Protein interactomes are ordered based on indegree values (x‐axis). Green protein names highlight those that localize to satellites.
hTERT RPE‐1 cells transiently expressing the indicated FLAG‐tagged proteins were fixed and stained with indicated antibodies. PCM1 and CEP135 were used for satellite and centriole markers, respectively. Scale bar, 5 μm.
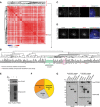
Correlation matrix and associated dendrogram created from the centrosome cluster of Fig EV3A using Gene‐E (details in Materials and Methods). Red arrow indicates location of PCM1 (zoomed in Appendix Fig S4A).
Dendrogram of the centrosome clustering results in (A). The HAUS complex (green) and TPGS1 cluster (purple) are highlighted. Black asterisks indicate known satellite components, and red asterisks indicate novel satellite proteins identified in this study (Fig 2C).
hTERT RPE‐1 cells stably expressing GFP‐TPGS1 were immunostained with antibodies directed against GFP, PCM1 (for satellites), γ‐tubulin (for centrosome), and DAPI. Scale bar, 5 μm.
Flp‐In T‐REx 293 cells stably expressing Tet‐inducible BirA*‐FLAG‐tagged TPGS1 were fixed 24 h after induction. Cells were stained with the indicated antibodies, Alexa Fluor 594‐coupled streptavidin for biotinylated proteins, and DAPI for nucleus. Scale bar, 5 μm.
Western blots demonstrating tetracycline‐inducible protein expression (anti‐Flag, top) and biotinylation of proximal proteins (streptavidin‐HRP, bottom) for BirA*‐FLAG‐TPGS1.
Distribution of TPGS1 preys identified using BioID. TPGS1 yielded proximity interactions with 55 high‐confidence preys, 31 of which are known satellite and/or centrosome proteins (see Table EV6 for the full list of interactors).
A subset of TPGS1 proximity interactors were validated by co‐IP. Flag pulldowns conducted on whole cell lysates of HEK293 cells expressing FLAG‐BirA*‐tagged CEP290, PCM1, OFD1, KIAA0753, or SSX2IP (or FLAG‐BirA* alone as a negative control) were subjected to immunoprecipitation using anti‐FLAG beads. Input supernatants and the IP material were separated via SDS–PAGE and immunoblotted using the indicated antibodies.
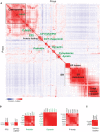
Global prey–prey heat map of the satellite and centrosome–cilia BioID networks (see Table EV5 for input). ProHits‐viz was used to calculate the Pearson correlation coefficient of preys that were detected with at least 20 spectral counts, captured with minimum two baits, and have AvgP ≥ 0.95. Clusters representing functional groups are highlighted. Cluster names (green) represent well‐described protein complexes, organelles, or functional groups, enlarged in (B).
Enlarged views of the protein complexes underlined in (A).
Enlarged view of the TPGS1 cluster from Fig 3A.
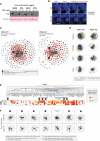
The correlation coefficient of several satellite bait proteins with PCM1 was extracted from the prey–prey clustering (Fig 3A red arrow, also enlarged in Appendix Fig S4A). Protein names highlighted in red were selected for further localization analysis presented in (C).
Schematic of the low‐ to super‐resolution microscopy pipeline used to analyze satellite protein localization (see Materials and Methods for details).
hTERT RPE‐1 cells were fixed with methanol and stained for PCM1 (green) and the indicated satellite marker (red). Two secondary antibodies labeled with different fluorophores were used to label PCM1 in both channels as control (top left panel). Samples were imaged using a 3D‐SIM super‐resolution microscope (OMX). White boxes represent the zoomed‐in regions, and the white arrowheads highlight examples of the satellite structures with reduced PCM1. See Appendix Fig S4C and D for more details. Scale bar, 3 μm. Note that the pixel size in the 3D‐SIM is half the size (0.04 μm) of the widefield (0.08 μm).
Box‐and‐whisker plot showing the two‐channel intensity correlation of pixels corresponding to regions identified with PCM1 and a second satellite marker (N = 200 cells per condition). Red lines indicate the average, and gray bars indicate SD.

RPE‐1 Cas9 WT and PCM1 KO cells were immunostained with antibodies directed against the indicated satellite proteins (green) and γ‐tubulin (for centrosome). In the PCM1 KO line, satellite structures are missing and the localization of the respective proteins is restricted to centrosomes. Scale bar, 3 μm.
To quantify the expression level of PCM1, different volumes of PCM1 WT lysates (10, 5, 2.5, and 1 μl) were loaded and compared to 10 μl of PCM1 KO lysate. The results indicate PCM1 level in KO cells is reduced to < 10% of WT cells. α‐Tubulin or Ponceau S red staining was used as the loading control.
FLAG‐BirA*‐tagged CCDC14, TEX9, or PIBF1 was transiently expressed in HEK293 WT or PCM1 KO cells, fixed 24 h after adding Tet and biotin, and stained with the indicated antibodies, Alexa Fluor 594‐coupled streptavidin and DAPI. PCM1 KO lines are devoid of satellite structures, and biotinylated satellite proteins are localized to centrosomes. Scale bar, 10 μm.
WB indicating PCM1 protein expression levels in WT versus PCM1 KO HEK293 cells expressing FLAG‐BirA*‐tagged CCDC66, TEX9, CCDC14, or PIBF1. Ponceau S red staining was used as the loading control. See Fig EV4B for additional analysis.
FLAG‐BirA*‐tagged CCDC66 was expressed in HEK293 WT or PCM1 KO cells. Cells were fixed 24 h after Tet and biotin addition, and stained with the indicated antibodies, Alexa Fluor 594‐coupled streptavidin, and DAPI. PCM1 KO lines are devoid of satellite structures, and the biotinylated satellite proteins are localized to centrosomes. See Fig EV4C for other baits. Scale bar, 10 μm.
Data‐driven interactome networks of CCDC14, CCDC66, PIBF1, and TEX9 identified in the presence (WT) or absence (KO) of PCM1.
Thumbnails of subnetworks (C) depicting individual bait protein interactomes. Large yellow nodes highlight individual bait proteins; blue nodes indicate the location of the other three bait proteins analyzed here; vertical bars highlight high‐confidence “core” interactors of each indicated bait (as defined in Fig 1C).
Satellite core protein component cluster (top; based on the Spearman rank correlation of peptide counts across the 22 satellite bait proteins). Heat map (bottom) highlighting moderate (orange) to substantial (red) loss of interactions in indicated BioID experiments performed in PCM1 KO and WT cells. Six protein modules displaying similar behavior (i.e., loss/no change in bait interactions in response to PCM1 depletion) are indicated.
Interaction profile of interactor modules (indicated in 5E), 1–6, and HAUS complex in the presence or absence of PCM1. Black nodes represent bait proteins interacting with one or more component(s) of a given module; white nodes indicate bait proteins not interacting with any component of the given module; red nodes highlight the prey components of a given module; green edges indicate high‐confidence bait–prey interactions present regardless of PCM1 status; black edges highlight high‐confidence bait–prey interactions lost upon PCM1 depletion; blue edges indicate high‐confidence bait–prey interactions gained upon PCM1 depletion.

Flp‐In T‐REx 293 cells were treated with DMSO (control) or centrinone for 7 days, then methanol‐fixed and stained with antibodies against FLAG and CEP135 (centrioles). In the centrinone‐treated cells, centrioles are lost and the PCM1 marked satellites are dispersed. Scale bar, 5 μm.
Cells (%) lacking centrioles based on micrographs in (A) (N = 300, three independent replicates (± SD), paired t‐test, ***P = 0.0001).
Baits subjected to BioID analysis in the centrinone experiment (see Table EV1 for more details).
Self‐organized interactome networks for the seven baits used to compare DMSO‐ and centrinone‐treated (centriole less) cells. The black dashed circle delineates the “core” region.
Venn diagrams indicating the number of high‐confidence preys detected in each condition (top, gray), and the number of preys in the core vs. periphery in both conditions (bottom, color) (see Table EV8 for details).
Heat map depicting log2 fold change (FC) peptide count ratio (centrinone/DMSO) of high‐confidence interactors (in either condition). Log2 FC > 1 (yellow): prey proteins enriched by centrinone treatment. Log2 FC < −1 (blue): preys depleted by centrinone treatment. Log2 FC between −1 and 1 (black).
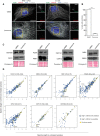
RPE‐1‐ΔTP53 and U‐2 OS cells were treated with DMSO (control) or centrinone for 7 days to deplete centrioles. They were fixed and stained for satellites (PCM1), centrioles (CEP135), and MT (α‐tubulin). Note that the MT network is not focused and PCM1 is dispersed in cells without centrioles (centrinone condition). Scale bar, 15 μm; insets: 5 μm.
Quantification of RPE‐1‐ΔTP53 cells without centrioles (± SD) based on the micrographs shown in (A) (N = 300, three independent replicates, paired t‐test, ***P = 0.0001).
Satellite protein abundance does not change in response to centrinone treatment. Flp‐In T‐REx 293 cells were lysed after treated either with DMSO or centrinone for 7 days. Extracts were blotted for the indicated satellite markers. Ponceau S red staining was used as the loading control.
High‐confidence preys in centrinone‐treated vs. untreated cells. Scatter plots display the log2 of the average spectral counts for individual prey proteins under both conditions. Yellow circles highlight satellite preys, and those with labels represent lost or gained satellite proteins in each case. Note that interactions between baits and most satellite preys are maintained in both conditions (see Table EV9 for plot input and loss and gain details).

Schematic representation of the drug treatments used before imaging and colocalization analysis. Satellites disperse following centrinone or nocodazole treatment.
Co‐IP demonstrates interactions between PCM1 and several satellite components. HEK293 cell lines stably expressing FLAG‐BirA* alone or FLAG‐BirA*‐PCM1 were subjected to DMSO (control), nocodazole, or centrinone treatment. Cell lysates were immunoprecipitated with anti‐FLAG beads. Input and IPs blotted as indicated. Anti‐FLAG detects FLAG‐BirA* (˜36kDa) in the control cell line and FLAG‐BirA*‐tagged PCM1 (˜300kDa) in the FLAG‐BirA*‐PCM1 cell line.
RPE‐1‐ΔTP53 cells were treated with DMSO (control), centrinone (7 days), or nocodazole (3 h), fixed with methanol and stained with antibodies directed against PCM1 (green), CEP290 or CCDC14 (red), γ‐tubulin (purple) to mark the centrosome, and DAPI (blue). Note dispersed satellites in nocodazole‐ and centrinone‐treated cells. White arrowheads highlight examples of the satellite structures that lack PCM1. Individual channels are shown in Fig EV6D. Scale bar, 10 μm.
Box‐and‐whisker plots displaying the coefficient of correlation of colocalization with PCM1 (N˜150 cells per condition) under the indicated conditions. Red lines indicate the average, and the purple or blue bars indicate SD. Two‐tailed t‐test, *P = 0.02.
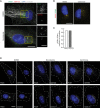
RPE‐1‐ΔTP53 cells were treated with DMSO or nocodazole, and stained with the indicated antibodies. The MT network is disrupted and satellites (PCM1 marker in green) are dispersed in the nocodazole‐treated sample. Scale bar, 2 μm; inset, 1 μm.
RPE‐1‐ΔTP53 cells were cultured in the presence of DMSO or centrinone, and stained with PCM1 primary antibody and two different Alexa Fluor (488, green and 594, red) secondary antibodies. Scale bar, 1 μm.
Bar graph shows the quantification for the correlation of colocalization between the two channels stained for PCM1 (N = 150 cells).
Individual channel representation of the merged images in Fig 7C. Scale bar, 10 μm.
Similar articles
-
A non-canonical function of Plk4 in centriolar satellite integrity and ciliogenesis through PCM1 phosphorylation.EMBO Rep. 2016 Mar;17(3):326-37. doi: 10.15252/embr.201541432. Epub 2016 Jan 11. EMBO Rep. 2016. PMID: 26755742 Free PMC article.
-
Centriolar satellite- and hMsd1/SSX2IP-dependent microtubule anchoring is critical for centriole assembly.Mol Biol Cell. 2015 Jun 1;26(11):2005-19. doi: 10.1091/mbc.E14-11-1561. Epub 2015 Apr 1. Mol Biol Cell. 2015. PMID: 25833712 Free PMC article.
-
Centriolar satellites are acentriolar assemblies of centrosomal proteins.EMBO J. 2019 Jul 15;38(14):e101082. doi: 10.15252/embj.2018101082. Epub 2019 Jun 3. EMBO J. 2019. PMID: 31304626 Free PMC article.
-
Navigating centriolar satellites: the role of PCM1 in cellular and organismal processes.FEBS J. 2025 Feb;292(4):688-708. doi: 10.1111/febs.17194. Epub 2024 Jun 2. FEBS J. 2025. PMID: 38825736 Free PMC article. Review.
-
Centriolar satellite biogenesis and function in vertebrate cells.J Cell Sci. 2020 Jan 2;133(1):jcs239566. doi: 10.1242/jcs.239566. J Cell Sci. 2020. PMID: 31896603 Review.
Cited by
-
Loss of Cep72 affects the morphology of spermatozoa in mice.Front Physiol. 2022 Oct 7;13:948965. doi: 10.3389/fphys.2022.948965. eCollection 2022. Front Physiol. 2022. PMID: 36277211 Free PMC article.
-
SLMAP3 is crucial for organogenesis through mechanisms involving primary cilia formation.Open Biol. 2024 Oct;14(10):rsob240206. doi: 10.1098/rsob.240206. Epub 2024 Oct 17. Open Biol. 2024. PMID: 39417621 Free PMC article.
-
Permanent cilia loss during cerebellar granule cell neurogenesis involves withdrawal of cilia maintenance and centriole capping.Proc Natl Acad Sci U S A. 2024 Dec 24;121(52):e2408083121. doi: 10.1073/pnas.2408083121. Epub 2024 Dec 20. Proc Natl Acad Sci U S A. 2024. PMID: 39705308 Free PMC article.
-
Spatial Centrosome Proteomic Profiling of Human iPSC-derived Neural Cells.Bio Protoc. 2023 Sep 5;13(17):e4812. doi: 10.21769/BioProtoc.4812. eCollection 2023 Sep 5. Bio Protoc. 2023. PMID: 37727868 Free PMC article.
-
USO1 Coordinates Centriolar Satellites to Regulate Male Germ Cell Proliferation and Cell Cycle Progression.Int J Mol Sci. 2025 Apr 30;26(9):4274. doi: 10.3390/ijms26094274. Int J Mol Sci. 2025. PMID: 40362515 Free PMC article.
References
-
- Andersen JS, Wilkinson CJ, Mayor T, Mortensen P, Nigg EA, Mann M (2003) Proteomic characterization of the human centrosome by protein correlation profiling. Nature 426: 570–574 - PubMed
-
- Audebert S, Koulakoff A, Berwald‐Netter Y, Gros F, Denoulet P, Edde B (1994) Developmental regulation of polyglutamylated alpha‐ and beta‐tubulin in mouse brain neurons. J Cell Sci 107(Pt. 8): 2313–2322 - PubMed
Publication types
MeSH terms
Substances
Grants and funding
LinkOut - more resources
Full Text Sources
Research Materials

