A Time-Embedding Network Models the Ontogeny of 23 Hepatic Drug Metabolizing Enzymes
- PMID: 31304741
- PMCID: PMC6933754
- DOI: 10.1021/acs.chemrestox.9b00223
A Time-Embedding Network Models the Ontogeny of 23 Hepatic Drug Metabolizing Enzymes
Abstract
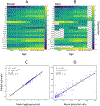
Pediatric patients are at elevated risk of adverse drug reactions, and there is insufficient information on drug safety in children. Complicating risk assessment in children, there are numerous age-dependent changes in the absorption, distribution, metabolism, and elimination of drugs. A key contributor to age-dependent drug toxicity risk is the ontogeny of drug metabolism enzymes, the changes in both abundance and type throughout development from the fetal period through adulthood. Critically, these changes affect not only the overall clearance of drugs but also exposure to individual metabolites. In this study, we introduce time-embedding neural networks in order to model population-level variation in metabolism enzyme expression as a function of age. We use a time-embedding network to model the ontogeny of 23 drug metabolism enzymes. The time-embedding network recapitulates known demographic factors impacting 3A5 expression. The time-embedding network also effectively models the nonlinear dynamics of 2D6 expression, enabling a better fit to clinical data than prior work. In contrast, a standard neural network fails to model these features of 3A5 and 2D6 expression. Finally, we combine the time-embedding model of ontogeny with additional information to estimate age-dependent changes in reactive metabolite exposure. This simple approach identifies age-dependent changes in exposure to valproic acid and dextromethorphan metabolites and suggests potential mechanisms of valproic acid toxicity. This approach may help researchers evaluate the risk of drug toxicity in pediatric populations.
Figures


Similar articles
-
Hepatic drug-metabolizing enzymes in primary and secondary tumors of human liver.Cancer Res. 1987 Jan 15;47(2):460-6. Cancer Res. 1987. PMID: 3024821
-
Characterization of Hepatic UDP-Glucuronosyltransferase Enzyme Abundance-Activity Correlations and Population Variability Using a Proteomics Approach and Comparison with Cytochrome P450 Enzymes.Drug Metab Dispos. 2021 Sep;49(9):760-769. doi: 10.1124/dmd.121.000474. Epub 2021 Jun 29. Drug Metab Dispos. 2021. PMID: 34187837
-
Enzyme-catalyzed detoxication reactions: mechanisms and stereochemistry.CRC Crit Rev Biochem. 1987;22(1):39-88. doi: 10.3109/10409238709082547. CRC Crit Rev Biochem. 1987. PMID: 3115676 Review.
-
Renal drug metabolism in humans: the potential for drug-endobiotic interactions involving cytochrome P450 (CYP) and UDP-glucuronosyltransferase (UGT).Br J Clin Pharmacol. 2013 Oct;76(4):587-602. doi: 10.1111/bcp.12086. Br J Clin Pharmacol. 2013. PMID: 23362865 Free PMC article. Review.
-
Use of Developmental Midazolam and 1-Hydroxymidazolam Data with Pediatric Physiologically Based Modeling to Assess Cytochrome P450 3A4 and Uridine Diphosphate Glucuronosyl Transferase 2B4 Ontogeny In Vivo.Drug Metab Dispos. 2023 Aug;51(8):1035-1045. doi: 10.1124/dmd.123.001270. Epub 2023 May 11. Drug Metab Dispos. 2023. PMID: 37169511
Cited by
-
No population left behind: Improving paediatric drug safety using informatics and systems biology.Br J Clin Pharmacol. 2022 Feb;88(4):1464-1470. doi: 10.1111/bcp.14705. Epub 2021 Jan 19. Br J Clin Pharmacol. 2022. PMID: 33332641 Free PMC article. Review.
-
Advances in computational methods along the exposure to toxicological response paradigm.Toxicol Appl Pharmacol. 2022 Sep 1;450:116141. doi: 10.1016/j.taap.2022.116141. Epub 2022 Jun 29. Toxicol Appl Pharmacol. 2022. PMID: 35777528 Free PMC article.
-
Advancing understanding of human variability through toxicokinetic modeling, in vitro-in vivo extrapolation, and new approach methodologies.Hum Genomics. 2024 Nov 21;18(1):129. doi: 10.1186/s40246-024-00691-9. Hum Genomics. 2024. PMID: 39574200 Free PMC article. Review.
-
Physiologically based pharmacokinetic modelling to predict artemether and lumefantrine exposure in neonates weighing less than 5 kg treated with artemether-lumefantrine to supplement the clinical data from the CALINA study.Trop Med Health. 2025 Aug 25;53(1):116. doi: 10.1186/s41182-025-00790-w. Trop Med Health. 2025. PMID: 40855460 Free PMC article.
-
Physiologically Based Pharmacokinetics Modeling in the Neonatal Population-Current Advances, Challenges, and Opportunities.Pharmaceutics. 2023 Nov 3;15(11):2579. doi: 10.3390/pharmaceutics15112579. Pharmaceutics. 2023. PMID: 38004559 Free PMC article. Review.
References
-
- Rodríguez-Mongui R; Otero MJ; Rovira J Assessing the Economic Impact of Adverse Drug Effects. PharmacoEconomics 2003, 21, 623–650. - PubMed
-
- White TJ; Arakelian A; Rho JP Counting the costs of drug-related adverse events. Pharmacoeconomics 1999, 15, 445–458. - PubMed
-
- Knowles SR; Uetrecht J; Shear NH Idiosyncratic drug reactions: the reactive metabolite syndromes. The Lancet 2000, 356, 1587–1591. - PubMed
-
- Park BK; Boobis A; Clarke S; Goldring CEP; Jones D; Kenna JG; Lambert C; Laverty HG; Naisbitt DJ; Nelson S; Nicoll-Griffith DA; Obach RS; Routledge P; Smith DA; Tweedie DJ; Vermeulen N; Williams DP; Wilson ID; Baillie TA Managing the challenge of chemically reactive metabolites in drug development. Nat. Rev. Drug Discovery 2011, 10, 292–306. - PubMed
Publication types
MeSH terms
Substances
Grants and funding
LinkOut - more resources
Full Text Sources
Medical

