. 2019 Jul 15:8:e45374.
doi: 10.7554/eLife.45374.

Gender variations in citation distributions in medicine are very small and due to self-citation and journal prestige

Affiliations

Gender variations in citation distributions in medicine are very small and due to self-citation and journal prestige

Jens Peter Andersen et al. Elife. .

Abstract

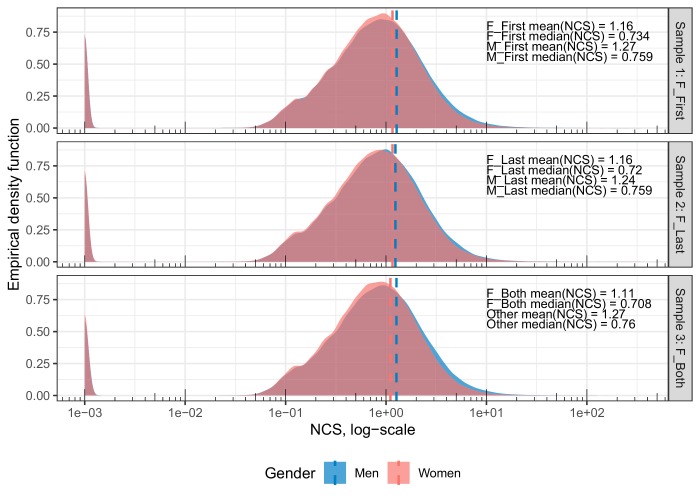
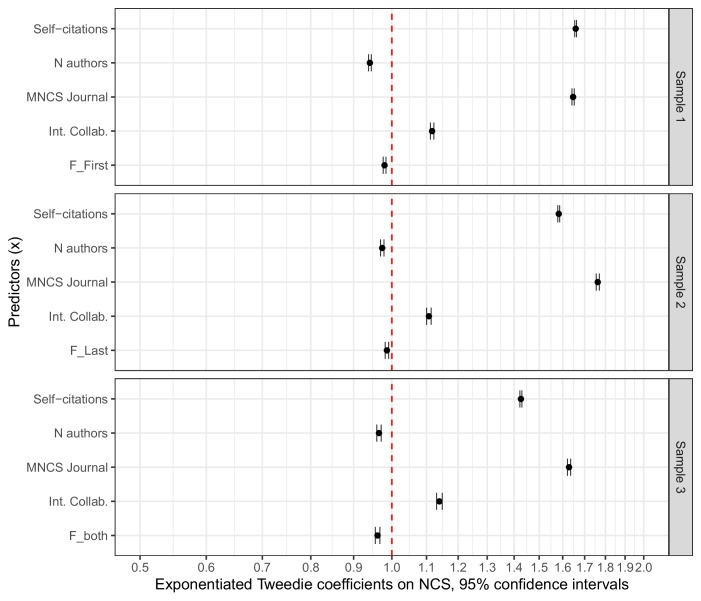
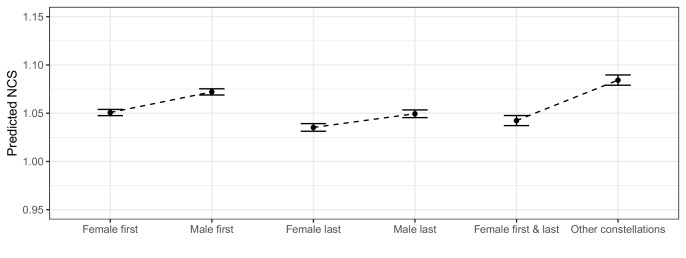
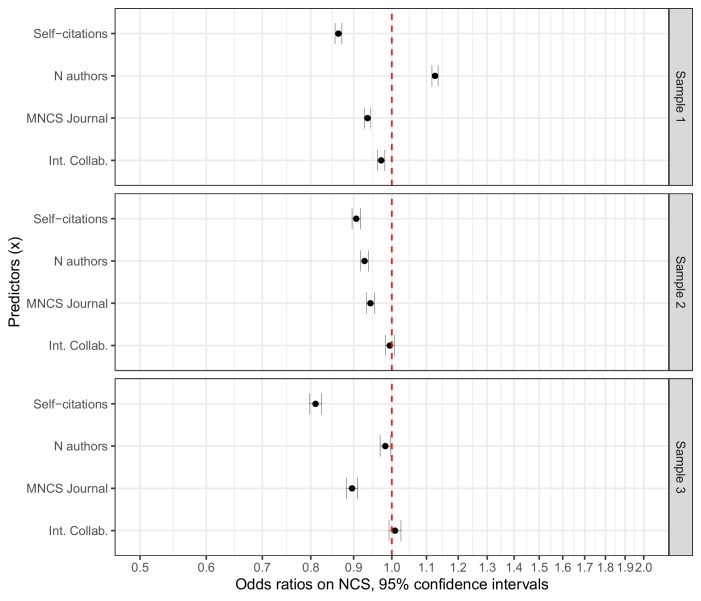
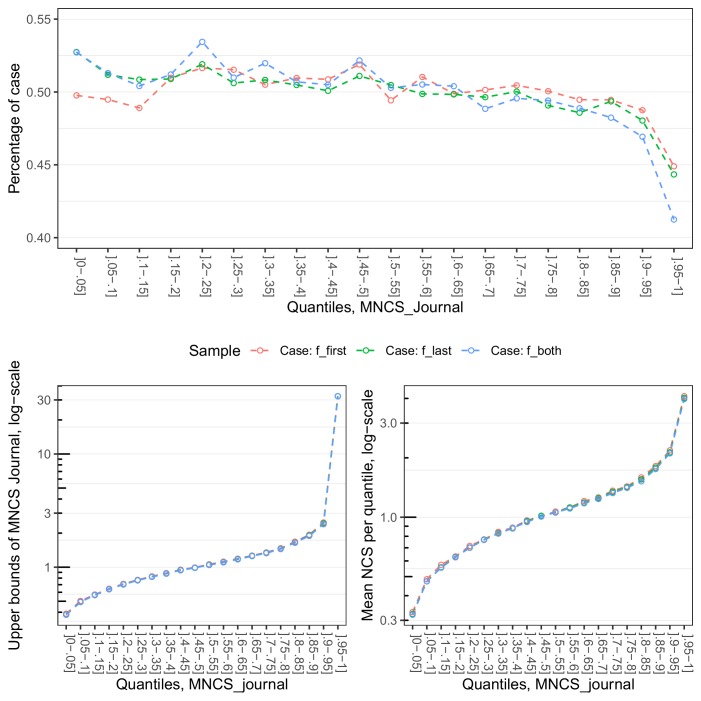
A number of studies suggest that scientific papers with women in leading-author positions attract fewer citations than those with men in leading-author positions. We report the results of a matched case-control study of 1,269,542 papers in selected areas of medicine published between 2008 and 2014. We find that papers with female authors are, on average, cited between 6.5 and 12.6% less than papers with male authors. However, the standardized mean differences are very small, and the percentage overlaps between the distributions for male and female authors are extensive. Adjusting for self-citations, number of authors, international collaboration and journal prestige, we find near-identical per-paper citation impact for women and men in first and last author positions, with self-citations and journal prestige accounting for most of the small average differences. Our study demonstrates the importance of focusing greater attention on within-group variability and between-group overlap of distributions when interpreting and reporting results of gender-based comparisons of citation impact.

Keywords: academic careers; bibliometrics; case-control study; citation analysis; gender disparity; human biology; medicine; meta-research; none.


Conflict of interest statement

JA, JS, MN No competing interests declared, RJ RJ: Stock options in Equity Quotient; advisory role and personal fees from Amgen; and consulting for Vizient.

Figures

Figure 1.
Figure 1.. Density distributions of the log-transformed, per-paper NCS for the matched set of male and female first authors (Sample 1), female and male last authors (Sample 2), and female first and last authors vs. other author combinations (Sample 3).
Dashed lines indicate the mean NCS for each sample. The y-axis indicates the proportion of papers found in that area of the NCS, equivalent to a smoothed histogram. The x-axis gives the per-paper NCS on a log-transformed scale. For all distributions, between-group overlap is extensive (93.1% to 95.6%). The difference between men and women is most clearly seen in the exceptionally highly cited studies, of which there are relatively few. Please note that. 001 (=1e-03) has been added to NCS in order to include uncited papers. The left-most peak in each sample represents uncited papers. The proportion of uncited papers per sample is 5.7%, 6.1%, and 5.9% for the case papers and 5.9%, 5.9%, and 5.8% for the control papers.
Figure 2.
Figure 2.. Standardized, exponentiated coefficients for the predictors included in the Tweedie regressions.
Error bars represent 95% confidence intervals (see Figure 2—source data 1 for estimate specifications and dispersion parameters). All regressions are based on matched samples. Sample 1 compares papers with female first authors to those with male first authors. Sample 2 compares papers with female last authors to those with male last authors. Sample 3 compares papers with female first and last authors to those with other author combinations. Values are on a logarithmic scale. The figure indicates very small residual effects of gender on NCS (case variables: F_First, F_Last and F_Both).
Figure 3.
Figure 3.. Plot of estimated marginal means for the case and control groups in Samples 1, 2 and 3.
The error bars display 95% confidence intervals. The figure visualizes the predicted, average, differences in per-paper citation scores for the case and control groups after adjusting for self-citations, number of authors, MNCS journal, and international collaboration. Sample 1 compares papers with female first authors to those with male first authors. Sample 2 compares papers with female last authors to those with male last authors. Sample 3 compares papers with female first and last authors to those with other author combinations. Note that the y-axis has a restricted span from. 95 to 1.15. The comparisons indicate trivial, average gender differences.
Figure 4.
Figure 4.. Odds ratios for the standardized predictors included in the logistic regressions.
Error bars represent 95% confidence intervals (see Figure 4—source data 1 for information on estimates and dispersion parameters). All regressions are based on matched samples. Sample 1 compares papers with female first authors to those with male first authors. Sample 2 compares papers with female last authors to those with male last authors. Sample 3 compares papers with female first and last authors to those with other author combinations. The figure indicates that self-citations is the variable that varies the most along gender lines in all three samples, albeit the effects can be considered small.
Figure 5.
Figure 5.. The upper panel shows the distribution of self-citations by five-percentile bins of NCS for each sample.
The average proportions of self-citations are given on the y-axis, the five-percentile bins of NCS on the x-axis. The lower panel displays the distribution of the upper bounds of NCS across the five-percentile bins of NCS. The upper bounds of NCS are given on the y-axis, and the five-percentile bins on the y-axis.
Figure 6.
Figure 6.. The upper panel shows the proportions of papers with female first authors in Sample 1, female last authors in Sample 2, combinations of female first and last authors in Sample 3, by five-percentile bins of MNCS.
The proportions of case papers are given on the y-axis, and the five-percentile bins of MNCS journal on the y-axis. The lower-left panel displays the upper bounds of MNCS journal by five-percentile bins of MNCS journal for each sample, while the lower-right panel shows the mean NCS by five-percentile bins of MNCS journal for each sample. The upper bounds of MNCS journal (left) and Mean NCS (right) are given on the y-axes, and the five-percentile bins of MNCS journal on the x-axes.
Figure 7.
Figure 7.. Flowchart of data collection, inclusion and exclusion.
Figure 7—figure supplement 1.
Figure 7—figure supplement 1.. Percentage of papers per journal included in the analysis.
The excluded papers are a combination of missing document types in Web of Science and missing name information. Journals publishing document types which are included in PubMed Medline but not Web of Science (e.g. comments, notes) can account for a large exclusion percentage for many journals. For other journals, first name information is consistently missing for some or all years. Here showing journals with >50 papers only.
Figure 7—figure supplement 2.
Figure 7—figure supplement 2.. Reliability of gender assignment per country, shown as the rank of countries.
Gender determination: The online tool Gender-API was used to estimate the gender of all first-name and country pairings. This pairing is important as the gender connotations for some first names vary by language and culture. As an example, the name Kim is typically male in Danish, female in English-speaking countries, and unisex in Korean. Gender-API uses co-occurrences of names and countries on social media to provide a precision score for each assignment, which we use to calculate a probability of an author being female, f. We exclude all authors from this analysis who only have initials registered in Web of Science, or who are from a country with unreliable gender prediction. Country sampling and bias: We calculated a reliability score for each country, by determining the precision score of the Gender-API name assignment for all authors per country. Names with precision scores >= 0.8 are considered reliable, and the reliability for the country is the average reliability hereof. We use the reliability distribution in Figure 7—figure supplement 2 to heuristically set a cut-off at .9 reliability for inclusion in the analysis. The excluded countries are listed in Figure 7—source data 1. For some of the East-Asian countries, the explanation for the low reliability lies in the unisex-naming culture of these countries. For other countries, the probable explanation is the absence of comprehensive social media data from these countries.
Figure 7—figure supplement 3.
Figure 7—figure supplement 3.. Proportion of papers with gender assignment for all authors.
Reported as function of all sampled papers (p_pubmed) and proportion of all papers matched to Web of Science (p_wos).

References

    1. Abramo G, D’Angelo CA, Murgia G. Gender differences in research collaboration. Journal of Informetrics. 2013;7:811–822. doi: 10.1016/j.joi.2013.07.002. - DOI
    1. Aksnes DW, Rorstad K, Piro F, Sivertsen G. Are female researchers less cited? A large-scale study of Norwegian scientists. Journal of the American Society for Information Science and Technology. 2011;62:628–636. doi: 10.1002/asi.21486. - DOI
    1. Araújo EB, Araújo NAM, Moreira AA, Herrmann HJ, Andrade JS. Gender differences in scientific collaborations: Women are more egalitarian than men. PLOS ONE. 2017;12:e0176791. doi: 10.1371/journal.pone.0176791. - DOI - PMC - PubMed
    1. Berg J. Looking inward at gender issues. Science. 2017;355:329. doi: 10.1126/science.aam8109. - DOI - PubMed
    1. Borrego Á, Barrios M, Villarroya A, Ollé C. Scientific output and impact of postdoctoral scientists: A gender perspective. Scientometrics. 2010;83:93–101. doi: 10.1007/s11192-009-0025-y. - DOI

Publication types