

Large vessels as a tree of transmission lines incorporated in the CircAdapt whole-heart model: A computational tool to examine heart-vessel interaction
- PMID: 31306411
- PMCID: PMC6677326
- DOI: 10.1371/journal.pcbi.1007173
Large vessels as a tree of transmission lines incorporated in the CircAdapt whole-heart model: A computational tool to examine heart-vessel interaction
Abstract
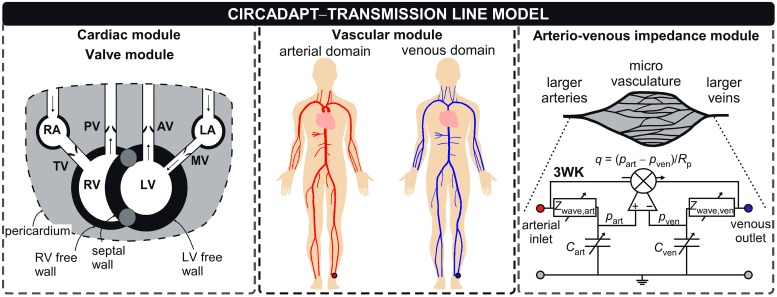
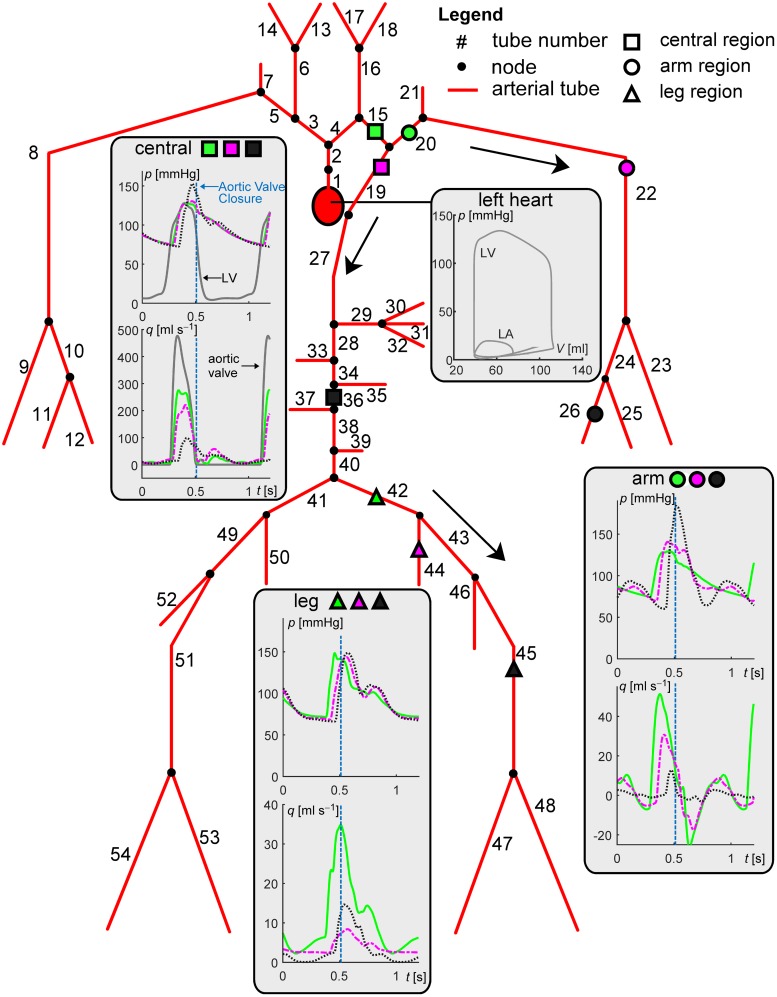
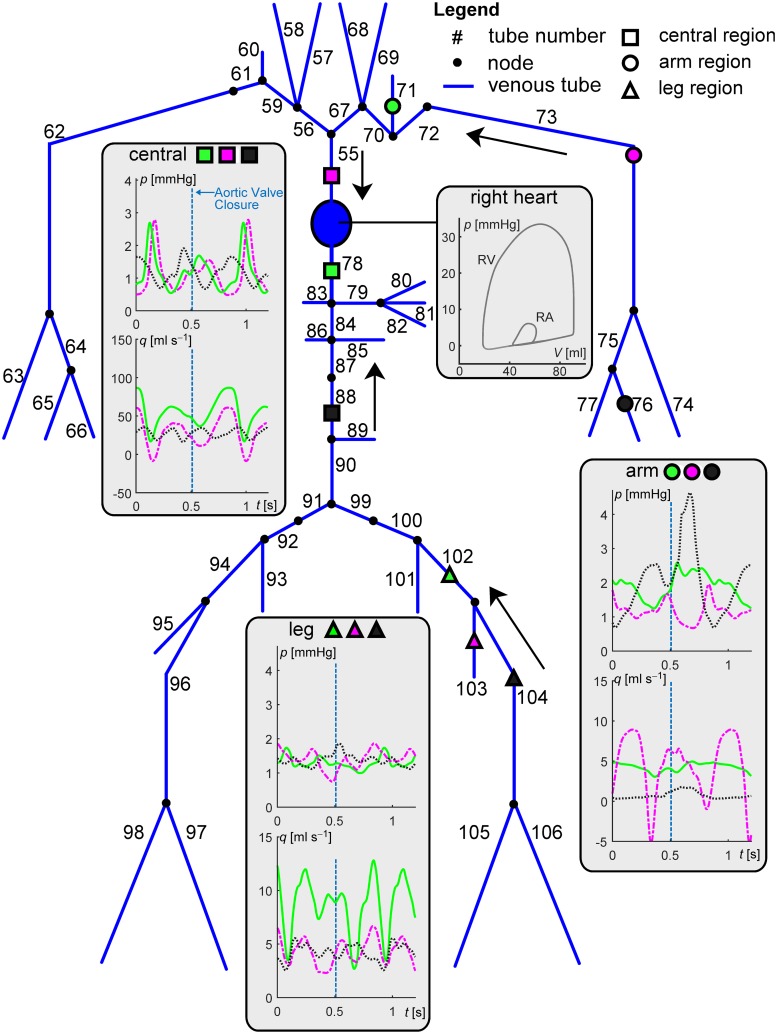
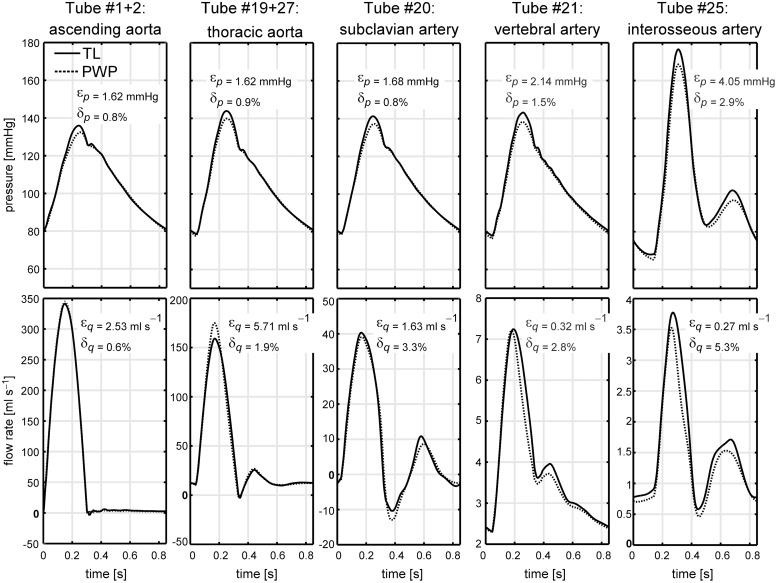
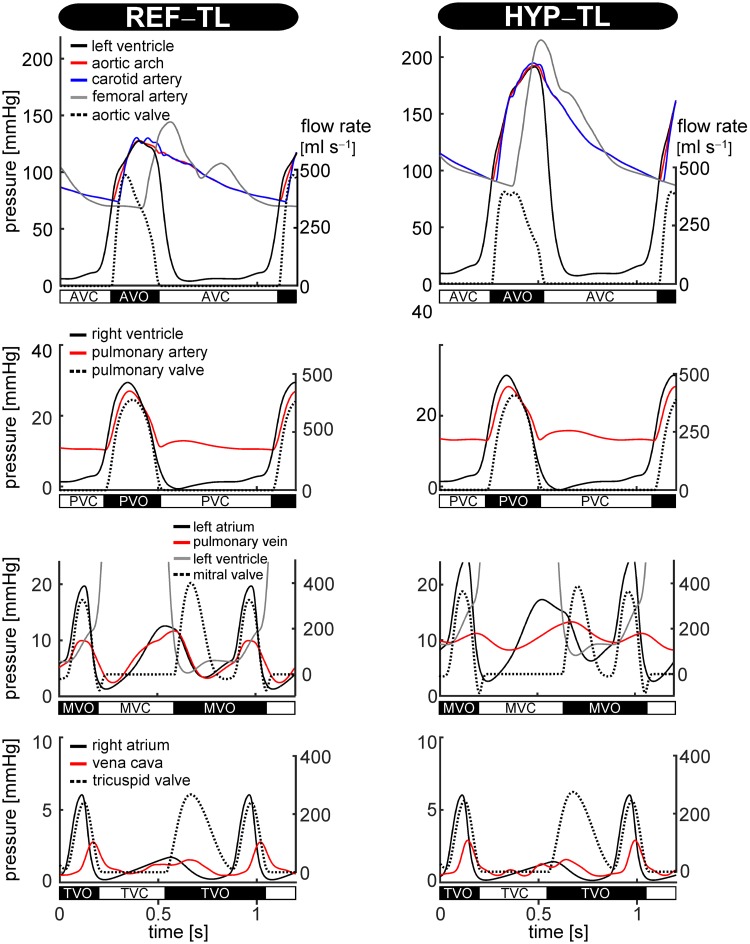
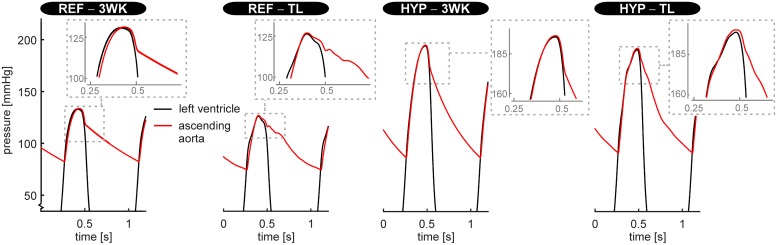
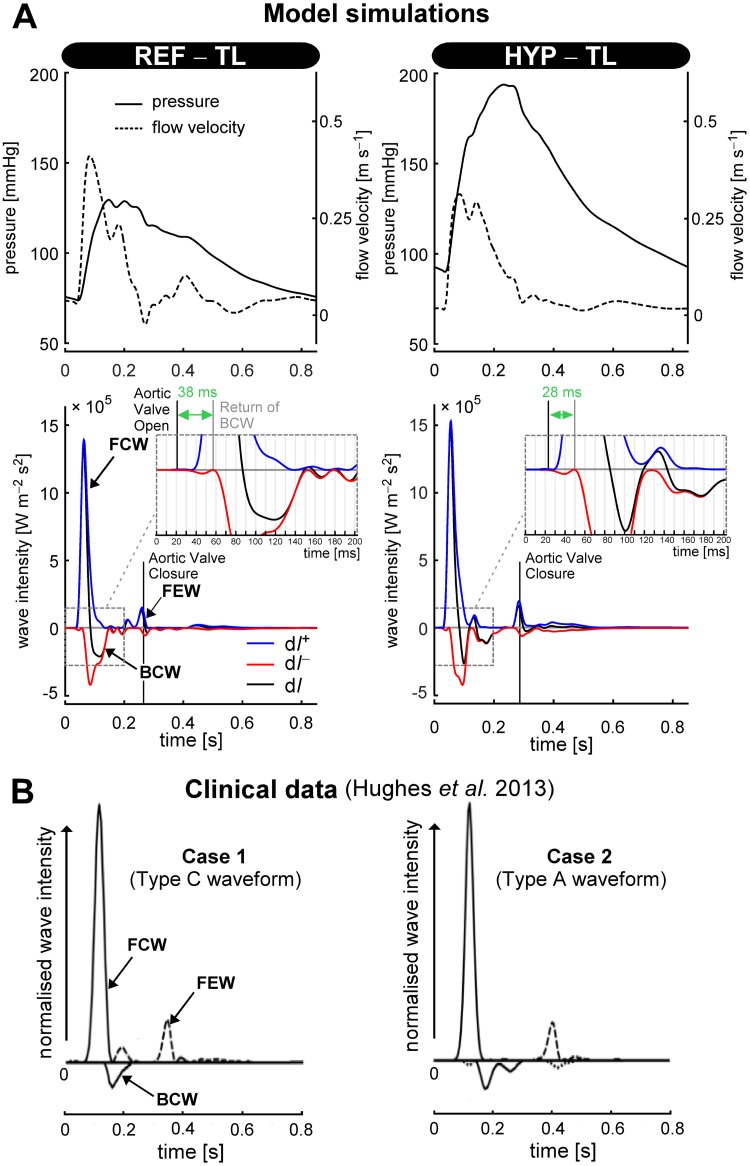
We developed a whole-circulation computational model by integrating a transmission line (TL) model describing vascular wave transmission into the established CircAdapt platform of whole-heart mechanics. In the present paper, we verify the numerical framework of our TL model by benchmark comparison to a previously validated pulse wave propagation (PWP) model. Additionally, we showcase the integrated CircAdapt-TL model, which now includes the heart as well as extensive arterial and venous trees with terminal impedances. We present CircAdapt-TL haemodynamics simulations of: 1) a systemic normotensive situation and 2) a systemic hypertensive situation. In the TL-PWP benchmark comparison we found good agreement regarding pressure and flow waveforms (relative errors ≤ 2.9% for pressure, and ≤ 5.6% for flow). CircAdapt-TL simulations reproduced the typically observed haemodynamic changes with hypertension, expressed by increases in mean and pulsatile blood pressures, and increased arterial pulse wave velocity. We observed a change in the timing of pressure augmentation (defined as a late-systolic boost in aortic pressure) from occurring after time of peak systolic pressure in the normotensive situation, to occurring prior to time of peak pressure in the hypertensive situation. The pressure augmentation could not be observed when the systemic circulation was lumped into a (non-linear) three-element windkessel model, instead of using our TL model. Wave intensity analysis at the carotid artery indicated earlier arrival of reflected waves with hypertension as compared to normotension, in good qualitative agreement with findings in patients. In conclusion, we successfully embedded a TL model as a vascular module into the CircAdapt platform. The integrated CircAdapt-TL model allows detailed studies on mechanistic studies on heart-vessel interaction.
Conflict of interest statement
The authors have declared that no competing interests exist.
Figures
Similar articles
-
A framework for incorporating 3D hyperelastic vascular wall models in 1D blood flow simulations.Biomech Model Mechanobiol. 2021 Aug;20(4):1231-1249. doi: 10.1007/s10237-021-01437-5. Epub 2021 Mar 8. Biomech Model Mechanobiol. 2021. PMID: 33683514 Free PMC article.
-
Wave propagation in a model of the arterial circulation.J Biomech. 2004 Apr;37(4):457-70. doi: 10.1016/j.jbiomech.2003.09.007. J Biomech. 2004. PMID: 14996557
-
In silico coronary wave intensity analysis: application of an integrated one-dimensional and poromechanical model of cardiac perfusion.Biomech Model Mechanobiol. 2016 Dec;15(6):1535-1555. doi: 10.1007/s10237-016-0782-5. Epub 2016 Mar 23. Biomech Model Mechanobiol. 2016. PMID: 27008197 Free PMC article.
-
Arterial elastance and wave reflection augmentation of systolic blood pressure: deleterious effects and implications for therapy.J Cardiovasc Pharmacol Ther. 2001 Jan;6(1):5-21. doi: 10.1177/107424840100600102. J Cardiovasc Pharmacol Ther. 2001. PMID: 11452332 Review.
-
Haemodynamic basis for the development of left ventricular failure in systolic hypertension and for its logical therapy.J Hypertens. 1995 Sep;13(9):943-52. doi: 10.1097/00004872-199509000-00002. J Hypertens. 1995. PMID: 8586828 Review.
Cited by
-
A fast computational model for circulatory dynamics: effects of left ventricle-aorta coupling.Biomech Model Mechanobiol. 2023 Jun;22(3):947-959. doi: 10.1007/s10237-023-01690-w. Epub 2023 Jan 13. Biomech Model Mechanobiol. 2023. PMID: 36639560 Free PMC article.
-
A Closed-Loop Modeling Framework for Cardiac-to-Coronary Coupling.Front Physiol. 2022 Feb 28;13:830925. doi: 10.3389/fphys.2022.830925. eCollection 2022. Front Physiol. 2022. PMID: 35295571 Free PMC article.
-
Diagnostic value of reversed differential cyanosis in (supra)cardiac total anomalous pulmonary venous return.Pediatr Res. 2025 Feb;97(2):809-817. doi: 10.1038/s41390-024-03355-5. Epub 2024 Jul 6. Pediatr Res. 2025. PMID: 38971943
-
Cardiovascular fetal-to-neonatal transition: an in silico model.Pediatr Res. 2022 Jan;91(1):116-128. doi: 10.1038/s41390-021-01401-0. Epub 2021 Mar 17. Pediatr Res. 2022. PMID: 33731808
-
Numerical accuracy of closed-loop steady state in a zero-dimensional cardiovascular model.Philos Trans A Math Phys Eng Sci. 2025 Apr 2;383(2293):20240208. doi: 10.1098/rsta.2024.0208. Epub 2025 Apr 2. Philos Trans A Math Phys Eng Sci. 2025. PMID: 40172559 Free PMC article.
References
-
- Palau-Caballero G, Walmsley J, Gorcsan J, Lumens J, Delhaas T. Abnormal Ventricular and Aortic Wall Properties Can Cause Inconsistencies in Grading Aortic Regurgitation Severity: A Computer Simulation Study. Journal of the American Society of Echocardiography. 2016;29(11):1122–1130. 10.1016/j.echo.2016.07.015 - DOI - PubMed
-
- Kuijpers NHL, Hermeling E, Lumens J, ten Eikelder HMM, Delhaas T, Prinzen FW. Mechano-electrical coupling as framework for understanding functional remodeling during LBBB and CRT. American Journal of Physiology-Heart and Circulatory Physiology. 2014;306(12):H1644–H1659. 10.1152/ajpheart.00689.2013 - DOI - PubMed
-
- Lumens J, Ploux S, Strik M, Gorcsan J, Cochet H, Derval N, et al. Comparative electromechanical and hemodynamic effects of left ventricular and biventricular pacing in dyssynchronous heart failure: electrical resynchronization versus left–right ventricular interaction. Journal of the American College of Cardiology. 2013;62(25):2395–2403. 10.1016/j.jacc.2013.08.715 - DOI - PMC - PubMed
Publication types
MeSH terms
LinkOut - more resources
Full Text Sources
