

Molecular dissection of the oncogenic role of ETS1 in the mesenchymal subtypes of head and neck squamous cell carcinoma
- PMID: 31306413
- PMCID: PMC6657958
- DOI: 10.1371/journal.pgen.1008250
Molecular dissection of the oncogenic role of ETS1 in the mesenchymal subtypes of head and neck squamous cell carcinoma
Abstract
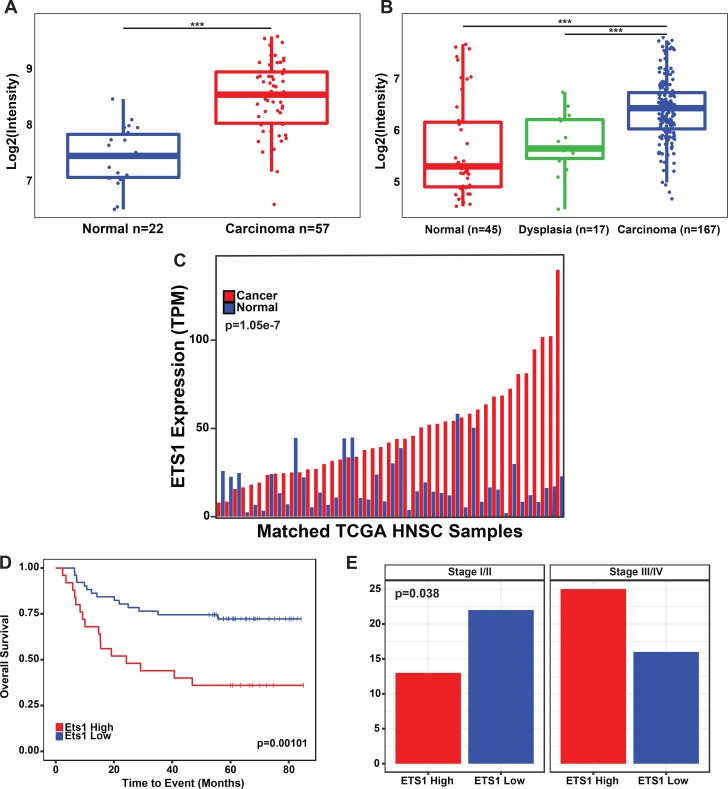
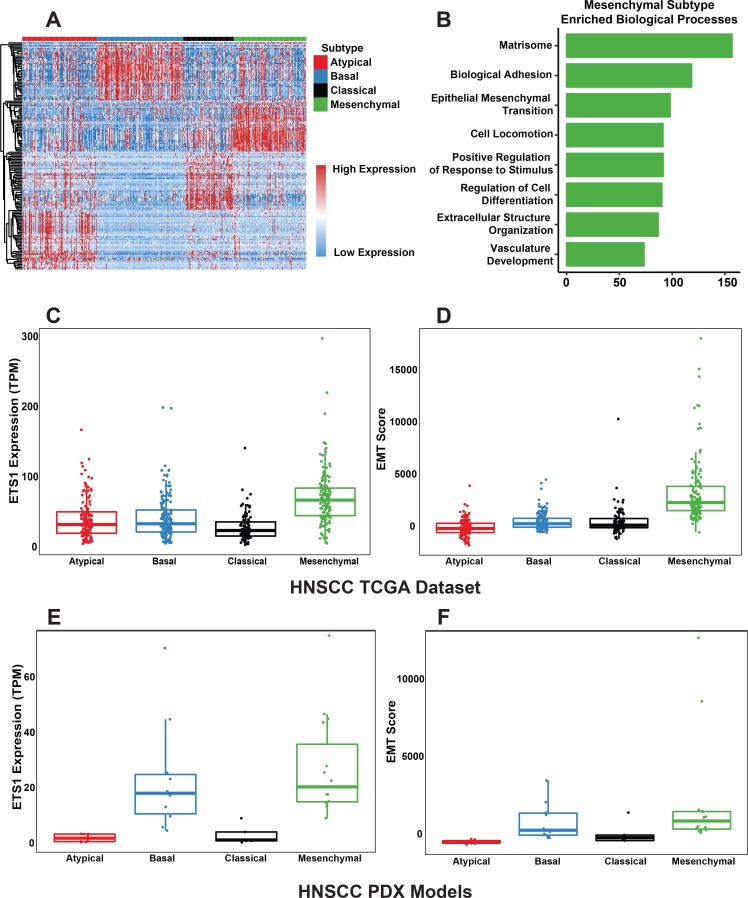
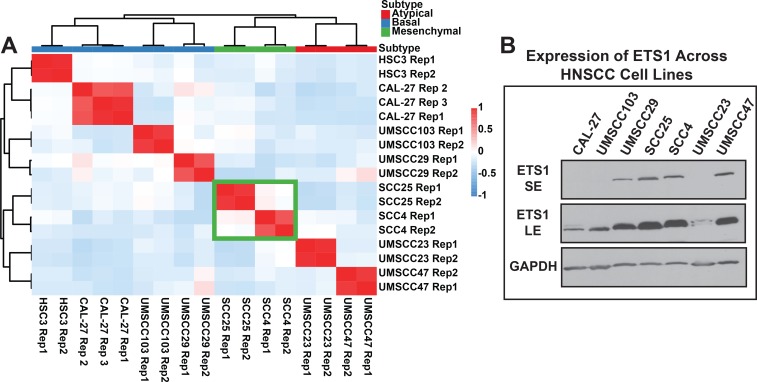
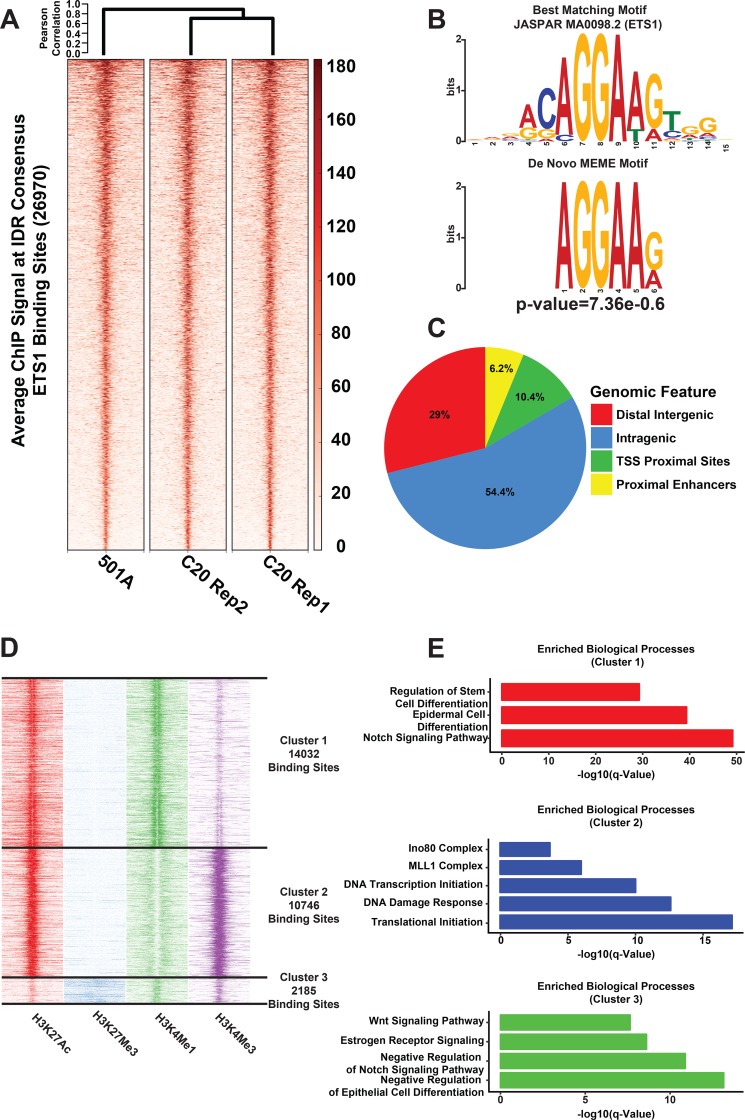
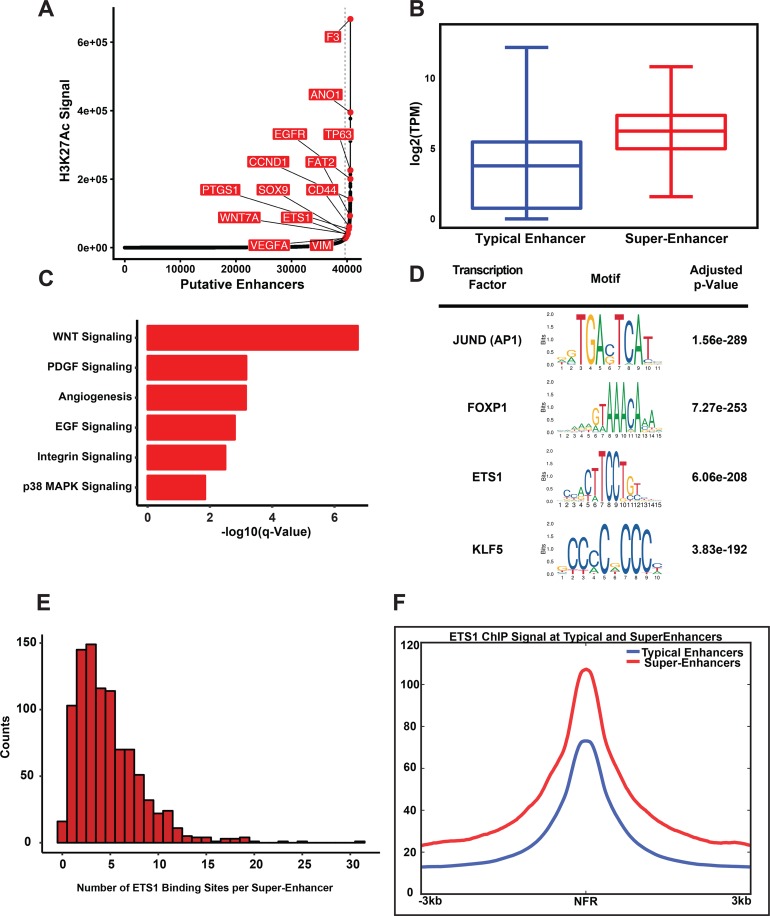
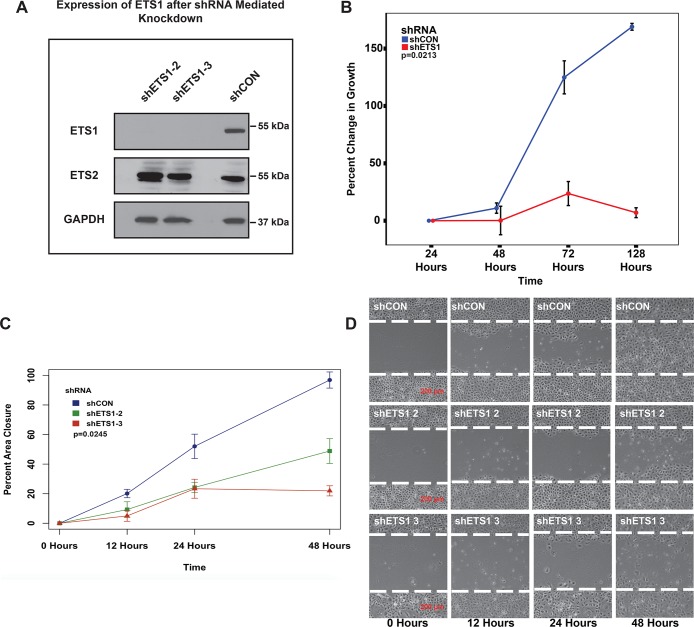
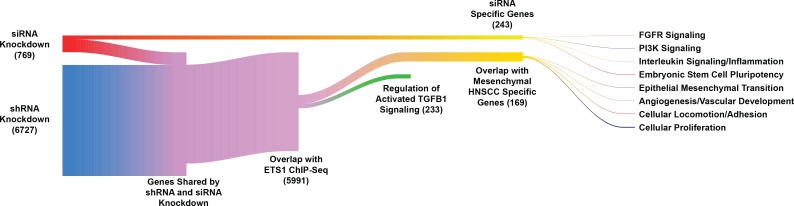
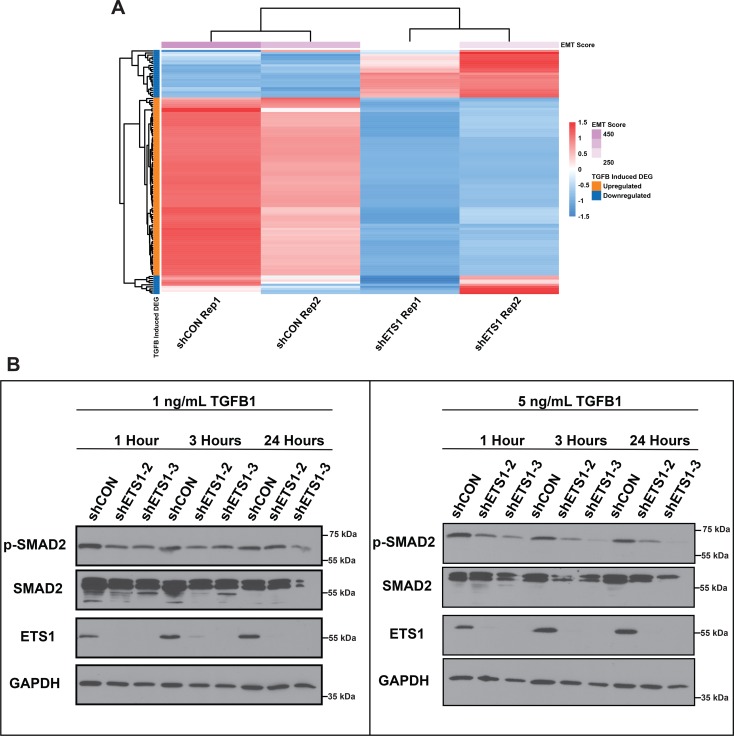
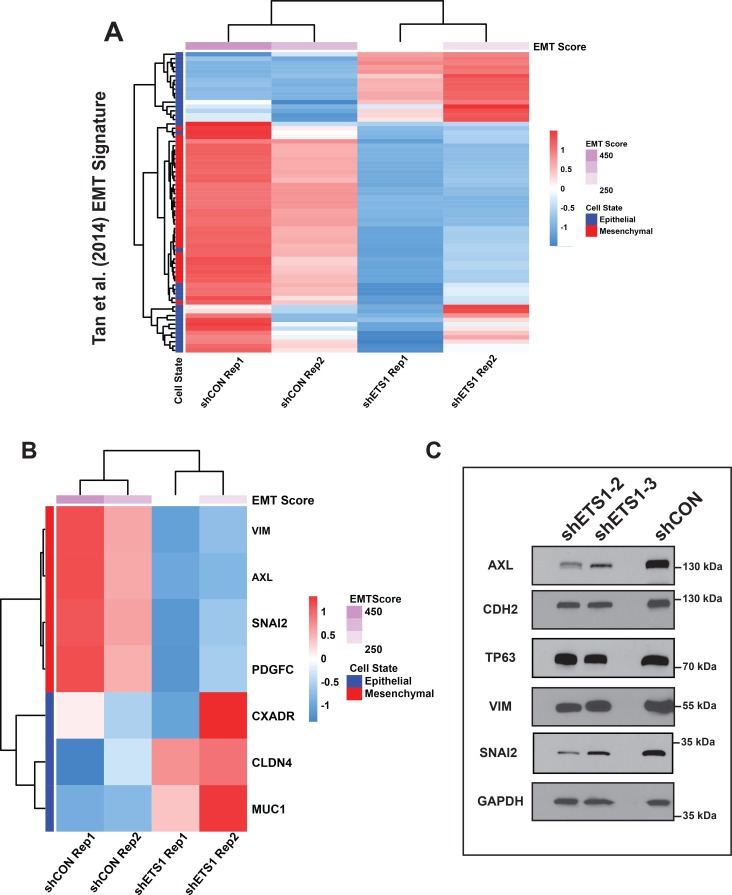
Head and Neck Squamous Cell Carcinoma (HNSCC) is a heterogeneous disease of significant mortality and with limited treatment options. Recent genomic analysis of HNSCC tumors has identified several distinct molecular classes, of which the mesenchymal subtype is associated with Epithelial to Mesenchymal Transition (EMT) and shown to correlate with poor survival and drug resistance. Here, we utilize an integrated approach to characterize the molecular function of ETS1, an oncogenic transcription factor specifically enriched in Mesenchymal tumors. To identify the global ETS1 cistrome, we have performed integrated analysis of RNA-Seq, ChIP-Seq and epigenomic datasets in SCC25, a representative ETS1high mesenchymal HNSCC cell line. Our studies implicate ETS1 as a crucial regulator of broader oncogenic processes and specifically Mesenchymal phenotypes, such as EMT and cellular invasion. We found that ETS1 preferentially binds cancer specific regulator elements, in particular Super-Enhancers of key EMT genes, highlighting its role as a master regulator. Finally, we show evidence that ETS1 plays a crucial role in regulating the TGF-β pathway in Mesenchymal cell lines and in leading-edge cells in primary HNSCC tumors that are endowed with partial-EMT features. Collectively our study highlights ETS1 as a key regulator of TGF-β associated EMT and reveals new avenues for sub-type specific therapeutic intervention.
Conflict of interest statement
The authors have declared that no competing interests exist.
Figures
Similar articles
-
The ETS1-LINC00278 negative feedback loop plays a role in COL4A1/COL4A2 regulation in laryngeal squamous cell carcinoma.Neoplasma. 2022 Jul;69(4):841-858. doi: 10.4149/neo_2022_220310N263. Epub 2022 May 9. Neoplasma. 2022. PMID: 35532293
-
Identification and validation a TGF-β-associated long non-coding RNA of head and neck squamous cell carcinoma by bioinformatics method.J Transl Med. 2018 Feb 28;16(1):46. doi: 10.1186/s12967-018-1418-6. J Transl Med. 2018. PMID: 29490660 Free PMC article.
-
ETS1 induces transforming growth factor β signaling and promotes epithelial-to-mesenchymal transition in prostate cancer cells.J Cell Biochem. 2019 Jan;120(1):848-860. doi: 10.1002/jcb.27446. Epub 2018 Aug 30. J Cell Biochem. 2019. PMID: 30161276
-
The role of the transcription factor Ets1 in carcinoma.Semin Cancer Biol. 2015 Dec;35:20-38. doi: 10.1016/j.semcancer.2015.09.010. Epub 2015 Sep 25. Semin Cancer Biol. 2015. PMID: 26392377 Review.
-
Long non-coding RNAs orchestrate various molecular and cellular processes by modulating epithelial-mesenchymal transition in head and neck squamous cell carcinoma.Biochim Biophys Acta Mol Basis Dis. 2021 Nov 1;1867(11):166240. doi: 10.1016/j.bbadis.2021.166240. Epub 2021 Aug 5. Biochim Biophys Acta Mol Basis Dis. 2021. PMID: 34363933 Review.
Cited by
-
Osteopontin Levels in Patients with Squamous Metastatic Head and Neck Cancer.Medicina (Kaunas). 2021 Feb 21;57(2):185. doi: 10.3390/medicina57020185. Medicina (Kaunas). 2021. PMID: 33670031 Free PMC article.
-
Transcription Factors in Cancer Development and Therapy.Cancers (Basel). 2020 Aug 15;12(8):2296. doi: 10.3390/cancers12082296. Cancers (Basel). 2020. PMID: 32824207 Free PMC article. Review.
-
An integrated genomic approach identifies follistatin as a target of the p63-epidermal growth factor receptor oncogenic network in head and neck squamous cell carcinoma.NAR Cancer. 2023 Jul 24;5(3):zcad038. doi: 10.1093/narcan/zcad038. eCollection 2023 Sep. NAR Cancer. 2023. PMID: 37492374 Free PMC article.
-
Tumor Microenvironment-Associated Immune-Related Genes for the Prognosis of Malignant Pleural Mesothelioma.Front Oncol. 2020 Sep 16;10:544789. doi: 10.3389/fonc.2020.544789. eCollection 2020. Front Oncol. 2020. PMID: 33042835 Free PMC article.
-
Multimodal Dimension Reduction and Subtype Classification of Head and Neck Squamous Cell Tumors.Front Oncol. 2022 Jul 13;12:892207. doi: 10.3389/fonc.2022.892207. eCollection 2022. Front Oncol. 2022. PMID: 35912202 Free PMC article.
References
Publication types
MeSH terms
Substances
LinkOut - more resources
Full Text Sources
Medical
Molecular Biology Databases
Research Materials
Miscellaneous
