. 2019 Oct:320:113011.
doi: 10.1016/j.expneurol.2019.113011. Epub 2019 Jul 12.

Muscle xenografts reproduce key molecular features of facioscapulohumeral muscular dystrophy

Affiliations

Muscle xenografts reproduce key molecular features of facioscapulohumeral muscular dystrophy

Amber L Mueller et al. Exp Neurol. 2019 Oct.

Abstract

Aberrant expression of DUX4, a gene unique to humans and primates, causes Facioscapulohumeral Muscular Dystrophy-1 (FSHD), yet the pathogenic mechanism is unknown. As transgenic overexpression models have largely failed to replicate the genetic changes seen in FSHD, many studies of endogenously expressed DUX4 have been limited to patient biopsies and myogenic cell cultures, which never fully differentiate into mature muscle fibers. We have developed a method to xenograft immortalized human muscle precursor cells from patients with FSHD and first-degree relative controls into the tibialis anterior muscle compartment of immunodeficient mice, generating human muscle xenografts. We report that FSHD cells mature into organized and innervated human muscle fibers with minimal contamination of murine myonuclei. They also reconstitute the satellite cell niche within the xenografts. FSHD xenografts express DUX4 and DUX4 downstream targets, retain the 4q35 epigenetic signature of their original donors, and express a novel protein biomarker of FSHD, SLC34A2. Ours is the first scalable, mature in vivo human model of FSHD. It should be useful for studies of the pathogenic mechanism of the disease as well as for testing therapeutic strategies targeting DUX4 expression.

Keywords: Biomarkers; DUX4; FSHD; Facioscapulohumeral muscular dystrophy; Hypomethylation; Satellite cells; Xenograft; hMPCs.


Figures

Figure 1.
Figure 1.. iNMES increases human muscle fiber number, diameter, and differentiation in FSHD and control xenografts.
(a) Cross sections of TA muscles carrying xenografts of control and FSHD hMPCs after iNMES were immunolabeled with antibodies to h-β-spectrin (green; sarcolemma of human fibers) and co-labeled with antibodies to desmin (red; human and murine myofibers; bars=200μm). (b) Human myofibers, labeled with anti-h-β-spectrin, were counted per xenograft within each group (control, n= 16; control+iNMES, n= 13; FSHD, n=20; FSHD+iNMES, n= 15). iNMES increased the number of human fibers formed in both FSHD (P<0.012) and control (P<0.0002) grafts. Each data point represents an individual xenograft. Lines show means ± SEM. (c) Engrafted fiber diameters were measured with FIJI. Data are means +SEM. Control+iNMES fibers (n=385) were larger than control (n=214, P<0.0001) fibers and FSHD+iNMES fibers were larger than FSHD fibers (P<0.0001). One-way ANOVA with Tukey’s multiple comparisons tests were used for (b) and (c). See Appendix C. S. Table 1 for all P-values. *P<0.05, ***P<0.001, ****P<0.0001. (d) Human fibers within cross sections of control (left) or FSHD (right) xenografts were labeled with anti-h-β-spectrin (green) and antibodies to embryonic myosin heavy chain (MYH-emb, red). iNMES treatment (lower panels) reduced expression of embryonic myosin, indicating greater maturation. Bars=50μm.
Figure 2.
Figure 2.. Mature properties of FSHD xenografts.
(a) We labeled frozen cross sections of FSHD and control xenografts with antibodies to h-β-spectrin and h-lamin A/C and counterstained with DAPI to label all nuclei. We identified all CNFs and counted human and murine central nuclei, identified as those nuclei that did or did not label for h-lamin A/C, respectively. CNFs, mouse or human, were expressed as a percentage of the number of human fibers. Data are means +SEM (control, n=11; and control+iNMES, n=13; FSHD, n=9; FSHD+iNMES, n=10). There were significantly more human CNFs than mouse CNFs when comparing all groups, mouse vs human (****P<0.0001). None of the differences within the mouse group or human group were significant (Two-way ANOVA with Bonferroni’s multiple comparisons test; see Appendix C. S. Table 2 for P-values). (b) A representative image of a cross section of an FSHD fiber from a graft subjected to iNMES and labeled with anti-h-β-spectrin (green) and anti-desmin (red). Desmin within a human fiber showed a reticular pattern, indicating mature organization of desmin filaments. Bar=5μm. (c) NMJs in an FSHD graft after iNMES treatment were labeled with α-bungarotoxin (AchR, blue; the postsynaptic membrane), and antibodies to h-β-spectrin (red; the human sarcolemma), and synaptophysin (Syp, green; presynaptic terminals). Bar=10μm (d) A representative image of a human satellite cell in an FSHD xenograft after iNMES. DAPI (blue) was used to label the nucleus of a mononuclear cell, which co-labeled with antibodies to the satellite cell marker, PAX7 (green). This cell’s nuclear envelope labeled with anti-h-lamin A/C (red) and was adjacent to a human muscle fiber (anti-h-β-spectrin, also red) within the basal lamina (labeled with antibodies to laminin, purple), defining it as a human satellite cell. Bar=5μm.
Figure 3.
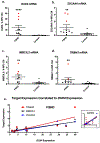
Figure 3.. FSHD xenografts express DUX4 and DUX4 target genes in a DUX4-dependent manner.
Nested qPCR was used with mRNA from TA muscles carrying FSHD and control xenografts to measure levels of DUX4 mRNA and mRNA encoding three of DUX4’s downstream targets (n=10 each), (a) DUX4 expression was greater in FSHD xenografts compared to controls (P<0.0001), with three xenografts expressing relatively high levels of DUX4 (red), (b-d) mRNA encoding DUX4 targets, ZSCAN4, MBD3L2 and TRIM43, was greater in FSHD xenografts compared to controls (P<0.0029, P<0.0039, P<0.0089, respectively). Red data points indicate results from the same 3 grafts, which had the highest levels of DUX4 and its targets across all assays (a-d). Lines within the scatter plots indicate means ± SEM. The Mann-Whitney U test was used for (a-d). (e) DUX4 target expression linearly correlated with DUX4 expression. R2 values from linear regression analyses of DUX4 to ZSCAN4 (blue), TRIM43 (red), and MBD3L2 (black) are 0.85, 0.60, and 0.77, respectively. **P<0.01,****P<0.0001.
Figure 4.
Figure 4.. FSHD and control sequences maintain epigenetic signature through culture and engraftment.
Representative BSS analysis of the distal D4Z4 RU on the contracted 4qA allele (BSSA) in a) FSHD hMPCs and b) an FSHD xenograft or the distal D4Z4 RUs of the long (black bar) and short (red bar) 4qB alleles (BSSB) in c) control hMPCs and d) a control xenograft. The BSSA assay analyzed 56 CpGs (columns) and the BSSB assay analyzed 16 CpGs (columns) from 12 independent chromosomes (rows). Red squares indicate methylated CpG, blue squares indicate unmethylated CpGs, and white squares indicate that the expected CpG was missing. Percent methylation for each sample is indicated (see SI Table 3 for more information).
Figure 5.
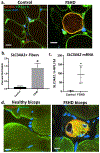
Figure 5.. Increased expression of a protein biomarker, SLC34A2, distinguishes FSHD from control xenografts.
(a) Antibodies to SLC34A2 (red), h-β-spectrin (green) and h-lamin A/C (green), as well as DAPI, were used to label FSHD and control xenografts. Bar=10μm. (b) Fibers expressing SLC34A2 were counted and displayed as a percentage of total human fibers within each xenograft type (n=4 each). FSHD grafts had more fibers expressing SLC34A2 than controls (mean +SEM; P<0.0286, Mann-Whitney U test), (c) qPCR was used with mRNA from TA muscles carrying FSHD (n=5) and control xenografts (n=3) to measure levels of SLC34A2 mRNA SLC34A2 was upregulated 47-fold in FSHD grafts compared to controls (mean ±SD; unpaired t-test with Welch’s correction, P<0.01). Black points represent results from qPCR analysis performed in triplicate. Grey points represent results from qPCR analysis from single reactions (due to limited sample). If only data from points analyzed in triplicate are used for statistics, P = 0.04. (d) SLC34A2 (red) positive fibers in an FSHD biceps biopsy. DAPI and anti-α-actinin identified nuclei and muscle fibers, respectively. All fibers in the cross section of control biceps were SLC34A2 negative. Bars=10 μm. *P<0.05, ****P<0.0001

Comment in

References

    1. van Deutekom JC, et al. (1993) FSHD associated DNA rearrangements are due to deletions of integral copies of a 3.2 kb tandemly repeated unit. Human molecular genetics 2(12):2037–2042. - PubMed
    1. Lemmers RJ, et al. (2002) Facioscapulohumeral muscular dystrophy is uniquely associated with one of the two variants of the 4q subtelomere. Nature genetics 32(2):235–236. - PubMed
    1. Gabriels J, et al. (1999) Nucleotide sequence of the partially deleted D4Z4 locus in a patient with FSHD identifies a putative gene within each 3.3 kb element. Gene 236(1):25–32. - PubMed
    1. Tupler R & Gabellini D (2004) Molecular basis of facioscapulohumeral muscular dystrophy. Cellular and molecular life sciences : CMLS 61(5):557–566. - PMC - PubMed
    1. Lemmers RJ, et al. (2010) A unifying genetic model for facioscapulohumeral muscular dystrophy. Science (New York, N. Y.) 329(5999):1650–1653. - PMC - PubMed

Publication types