

Anti-inflammatory treatment with a soluble epoxide hydrolase inhibitor attenuates seizures and epilepsy-associated depression in the LiCl-pilocarpine post-status epilepticus rat model
- PMID: 31306773
- PMCID: PMC6873816
- DOI: 10.1016/j.bbi.2019.07.014
Anti-inflammatory treatment with a soluble epoxide hydrolase inhibitor attenuates seizures and epilepsy-associated depression in the LiCl-pilocarpine post-status epilepticus rat model
Abstract
Purpose: This study aimed to investigate whether 1-trifluoromethoxyphenyl-3-(1-propionylpiperidin-4-yl) urea (TPPU), a soluble epoxide hydrolase inhibitor with anti-inflammatory effects, could alleviate spontaneous recurrent seizures (SRS) and epilepsy-associated depressive behaviours in the lithium chloride (LiCl)-pilocarpine-induced post-status epilepticus (SE) rat model.
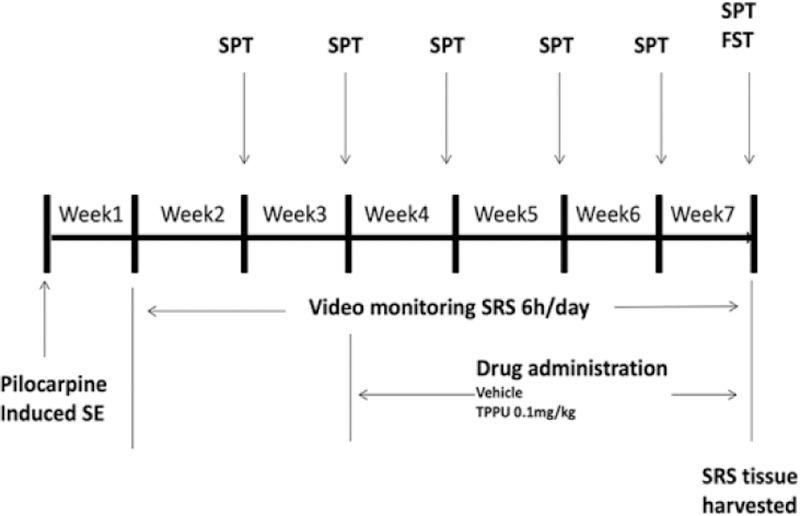
Methods: The rats were intraperitoneally (IP) injected with LiCl (127 mg/kg) and pilocarpine (40 mg/kg) to induce SE. A video surveillance system was used to monitor SRS in the post-SE model for 6 weeks (from the onset of the 2nd week to the end of the 7th week after SE induction). TPPU (0.1 mg/kg/d) was intragastrically given for 4 weeks from the 21st day after SE induction in the SRS + 0.1 TPPU group. The SRS + PEG 400 group was given the vehicle (40% polyethylene glycol 400) instead, and the control group was given LiCl and PEG 400 but not pilocarpine. The sucrose preference test (SPT) and forced swim test (FST) were conducted to evaluate the depression-like behaviours of rats. Immunofluorescent staining, enzyme-linked immunosorbent assay, and western blot analysis were performed to measure astrocytic and microglial gliosis, neuronal loss, and levels of soluble epoxide hydrolase (sEH), cytokines [tumour necrosis factor alpha (TNF-α), interleukin (IL)-1β, and IL-6], and cyclic adenosine monophosphate (cAMP)-response element binding protein (CREB).
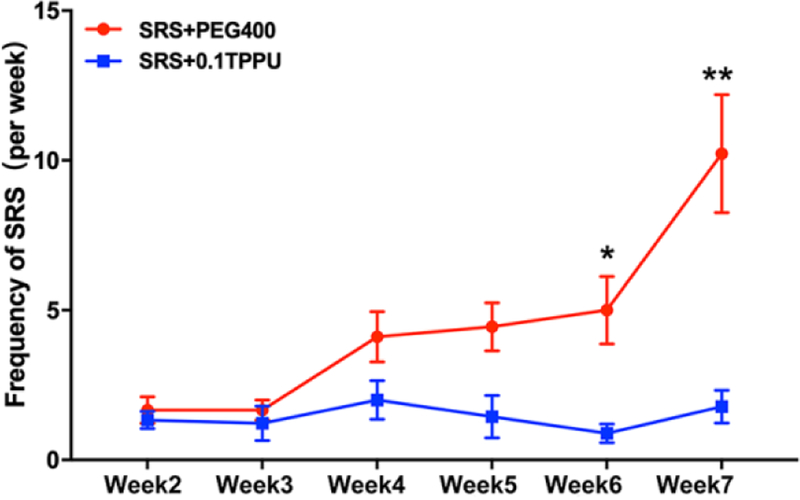
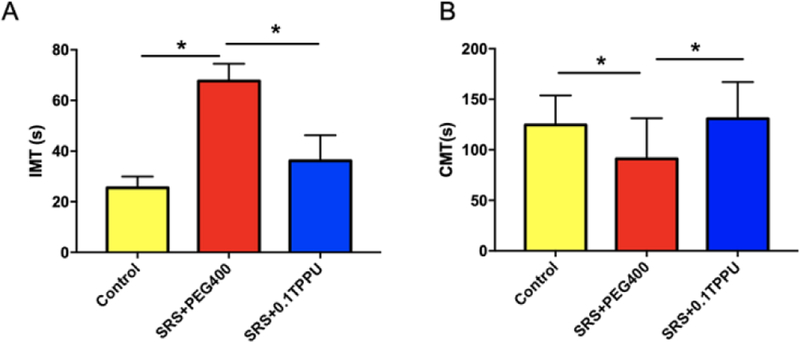
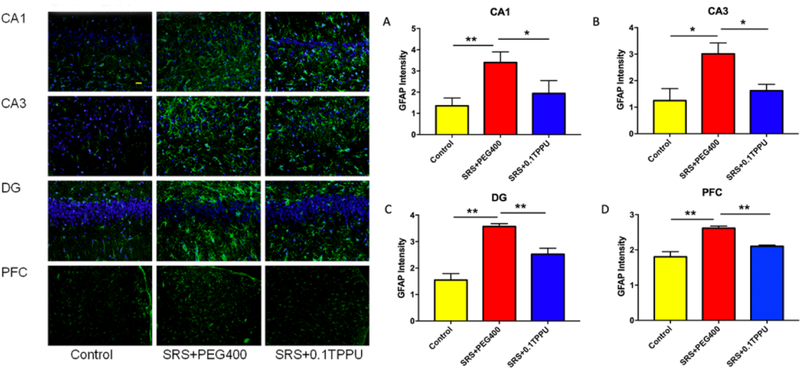
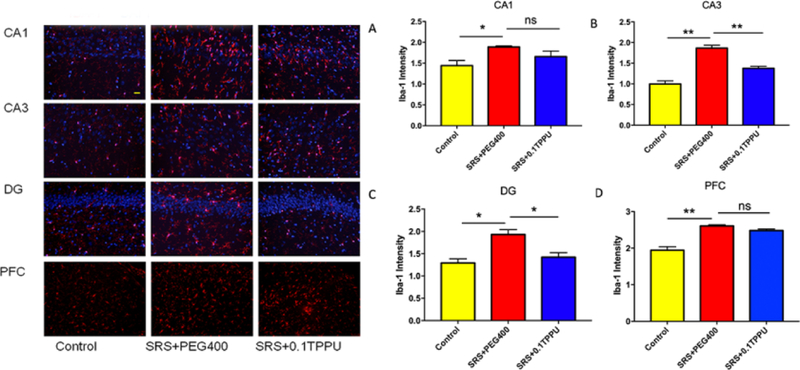
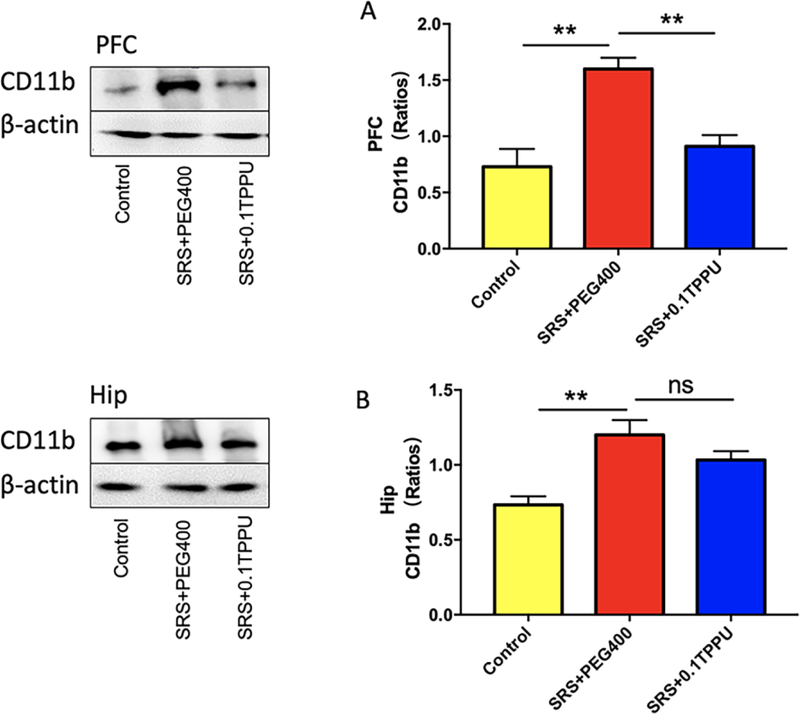
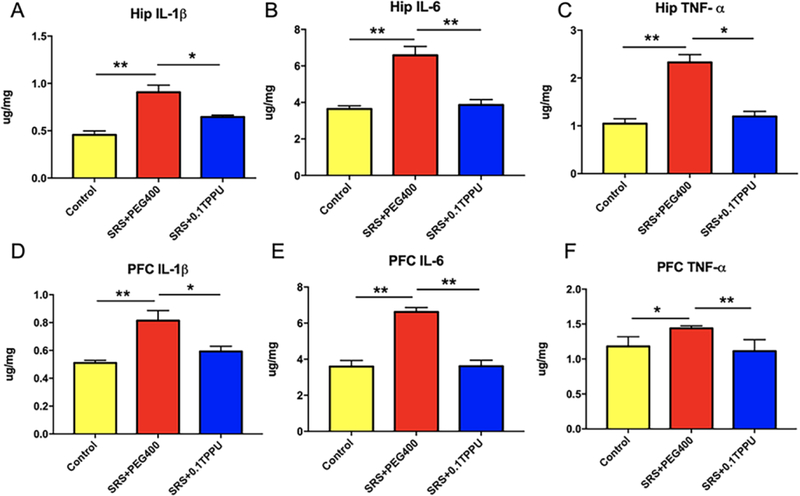
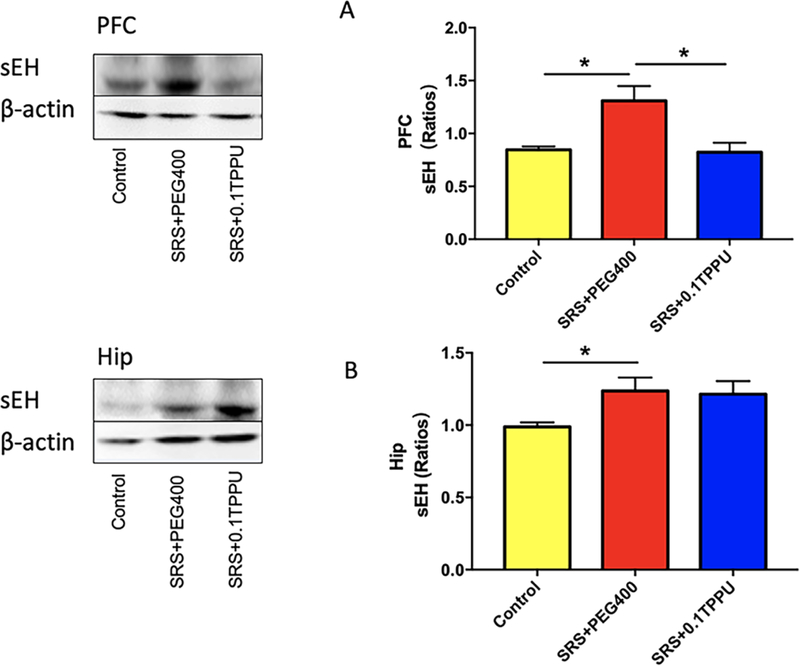
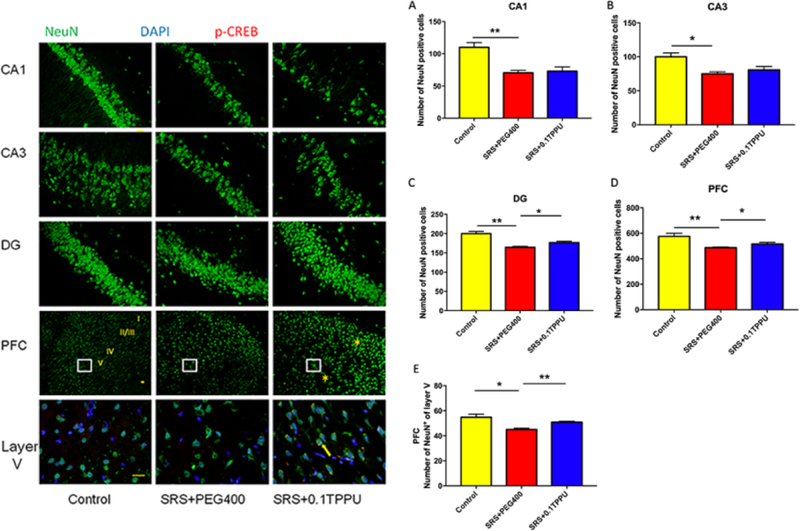
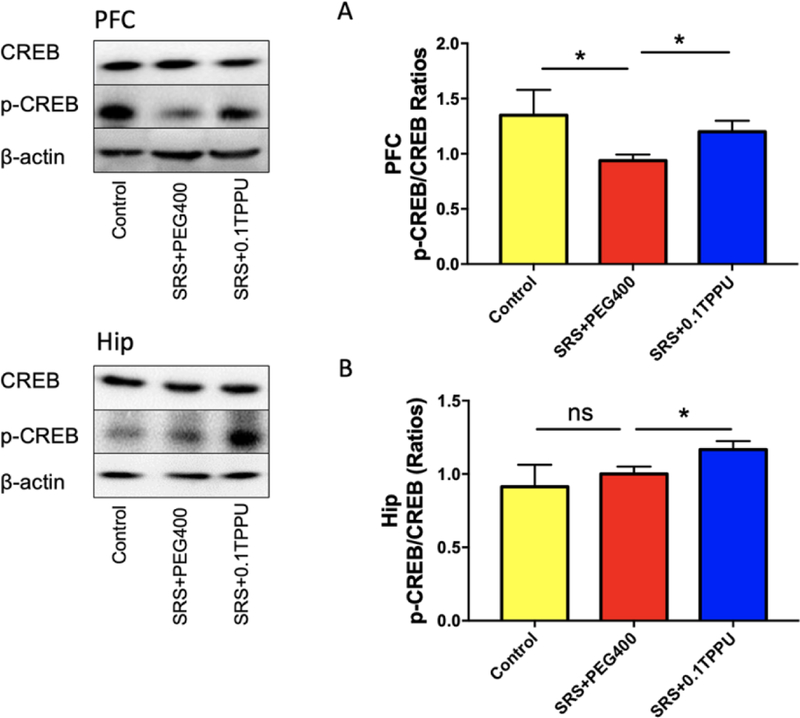
Results: The frequency of SRS was significantly decreased at 6 weeks and 7 weeks after SE induction in the 0.1TPP U group compared with the SRS + PEG 400 group. The immobility time (IMT) evaluated by FST was significantly decreased, whereas the climbing time (CMT) was increased, and the sucrose preference rate (SPR) evaluated by SPT was in an increasing trend. The levels of sEH, TNF-α, IL-1β, and IL-6 in the hippocampus (Hip) and prefrontal cortex (PFC) were all significantly increased in the SRS + PEG 400 group compared with the control group; neuronal loss, astrogliosis, and microglial activation were also observed. The astrocytic and microglial activation and levels of the pro-inflammatory cytokines in the Hip and PFC were significantly attenuated in the TPPU group compared with the SRS + PEG 400 group; moreover, neuronal loss and the decreased CREB expression were significantly alleviated as well.
Conclusion: TPPU treatment after SE attenuates SRS and epilepsy-associated depressive behaviours in the LiCl-pilocarpine induced post-SE rat model, and it also exerts anti-inflammatory effects in the brain. Our findings suggest a new therapeutic approach for epilepsy and its comorbidities, especially depression.
Copyright © 2019 Elsevier Inc. All rights reserved.
Conflict of interest statement
Competing Interests:
None of the authors has any conflict of interest related to this manuscript.
Figures
Similar articles
-
Inhibiting the soluble epoxide hydrolase increases the EpFAs and ERK1/2 expression in the hippocampus of LiCl-pilocarpine post-status epilepticus rat model.IBRO Neurosci Rep. 2024 Oct 11;17:329-336. doi: 10.1016/j.ibneur.2024.10.001. eCollection 2024 Dec. IBRO Neurosci Rep. 2024. PMID: 39492986 Free PMC article.
-
TPPU Pre-Treatment Rescues Dendritic Spine Loss and Alleviates Depressive Behaviours during the Latent Period in the Lithium Chloride-Pilocarpine-Induced Status Epilepticus Rat Model.Brain Sci. 2021 Nov 5;11(11):1465. doi: 10.3390/brainsci11111465. Brain Sci. 2021. PMID: 34827464 Free PMC article.
-
Soluble epoxide hydrolase activity regulates inflammatory responses and seizure generation in two mouse models of temporal lobe epilepsy.Brain Behav Immun. 2015 Jan;43:118-29. doi: 10.1016/j.bbi.2014.07.016. Epub 2014 Aug 15. Brain Behav Immun. 2015. PMID: 25135858
-
Research progress on the protective mechanism of a novel soluble epoxide hydrolase inhibitor TPPU on ischemic stroke.Front Neurol. 2023 Feb 8;14:1083972. doi: 10.3389/fneur.2023.1083972. eCollection 2023. Front Neurol. 2023. PMID: 36846137 Free PMC article. Review.
-
Neurobiology of Depression as a Comorbidity of Epilepsy.In: Noebels JL, Avoli M, Rogawski MA, Olsen RW, Delgado-Escueta AV, editors. Jasper's Basic Mechanisms of the Epilepsies [Internet]. 4th edition. Bethesda (MD): National Center for Biotechnology Information (US); 2012. In: Noebels JL, Avoli M, Rogawski MA, Olsen RW, Delgado-Escueta AV, editors. Jasper's Basic Mechanisms of the Epilepsies [Internet]. 4th edition. Bethesda (MD): National Center for Biotechnology Information (US); 2012. PMID: 22787593 Free Books & Documents. Review.
Cited by
-
Chronically altered NMDAR signaling in epilepsy mediates comorbid depression.Acta Neuropathol Commun. 2021 Mar 24;9(1):53. doi: 10.1186/s40478-021-01153-2. Acta Neuropathol Commun. 2021. PMID: 33762011 Free PMC article.
-
Total Triterpenes of Wolfiporia cocos (Schwein.) Ryvarden & Gilb Exerts Antidepressant-Like Effects in a Chronic Unpredictable Mild Stress Rat Model and Regulates the Levels of Neurotransmitters, HPA Axis and NLRP3 Pathway.Front Pharmacol. 2022 Feb 14;13:793525. doi: 10.3389/fphar.2022.793525. eCollection 2022. Front Pharmacol. 2022. PMID: 35237160 Free PMC article.
-
Pharmacological inhibition of S6K1 rescues synaptic deficits and attenuates seizures and depression in chronic epileptic rats.CNS Neurosci Ther. 2024 Mar;30(3):e14475. doi: 10.1111/cns.14475. Epub 2023 Sep 22. CNS Neurosci Ther. 2024. PMID: 37736829 Free PMC article.
-
Propofol mitigates brain injury and oxidative stress, and enhances GABAA receptor α1 subunit expression in a rat model of lithium chloride-pilocarpine induced status epilepticus.Turk J Med Sci. 2023 May 25;53(5):1058-1066. doi: 10.55730/1300-0144.5670. eCollection 2023. Turk J Med Sci. 2023. PMID: 38813010 Free PMC article.
-
Sex-Specific Response of the Brain Free Oxylipin Profile to Soluble Epoxide Hydrolase Inhibition.Nutrients. 2023 Feb 28;15(5):1214. doi: 10.3390/nu15051214. Nutrients. 2023. PMID: 36904213 Free PMC article.
References
-
- Keezer MR, Sisodiya SM, Sander JW. Comorbidities of epilepsy: current concepts and future perspectives. Lancet Neurol 2016;15:106–115. - PubMed
-
- Kanner AM. Can Neurochemical Changes of Mood Disorders Explain the Increase Risk of Epilepsy or its Worse Seizure Control? Neurochem Res 2017;42:2071–2076. - PubMed
-
- Mula M. Epilepsy and Psychiatric Comorbidities: Drug Selection. Curr Treat Options Neurol 2017;19:44. - PubMed
Publication types
MeSH terms
Substances
Grants and funding
LinkOut - more resources
Full Text Sources
Medical
Miscellaneous
