. 2019 Jul 1;8(7):giz082.
doi: 10.1093/gigascience/giz082.

PRSice-2: Polygenic Risk Score software for biobank-scale data

Affiliations

PRSice-2: Polygenic Risk Score software for biobank-scale data

Shing Wan Choi et al. Gigascience. .

Abstract

Background: Polygenic risk score (PRS) analyses have become an integral part of biomedical research, exploited to gain insights into shared aetiology among traits, to control for genomic profile in experimental studies, and to strengthen causal inference, among a range of applications. Substantial efforts are now devoted to biobank projects to collect large genetic and phenotypic data, providing unprecedented opportunity for genetic discovery and applications. To process the large-scale data provided by such biobank resources, highly efficient and scalable methods and software are required.

Results: Here we introduce PRSice-2, an efficient and scalable software program for automating and simplifying PRS analyses on large-scale data. PRSice-2 handles both genotyped and imputed data, provides empirical association P-values free from inflation due to overfitting, supports different inheritance models, and can evaluate multiple continuous and binary target traits simultaneously. We demonstrate that PRSice-2 is dramatically faster and more memory-efficient than PRSice-1 and alternative PRS software, LDpred and lassosum, while having comparable predictive power.

Conclusion: PRSice-2's combination of efficiency and power will be increasingly important as data sizes grow and as the applications of PRS become more sophisticated, e.g., when incorporated into high-dimensional or gene set-based analyses. PRSice-2 is written in C++, with an R script for plotting, and is freely available for download from http://PRSice.info.

Keywords: GWAS; imputation; polygenic risk score.


Figures

Figure 1.
Figure 1.
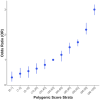
Strata plot generated by PRSice-2. The X-axis shows the range of different quantiles (e.g., (80,90] corresponds to those individuals with PRS between the 80th and 90th percentile of the population), and the Y-axis shows the odds ratio when comparing PRS from different quantiles with the reference quantile (here, (40,60]), with the bars corresponding to 95% confidence intervals of the odds ratio.
Figure 2.
Figure 2.
Performance of the 3 PRS software programs on simulated data. (a) Mean run time (in minutes) required to complete the entire analysis, across 10 repeats, when applied to different sizes of target sample. (b) Mean memory (in GB) required for the different software programs to process the different sizes of target sample.
Figure 3.
Figure 3.
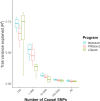
Predictive accuracy of the 3 PRS software programs for a simulated trait with heritability h2 = 0.2, target sample size of 10,000, and base sample size of 50,000. The 3 programs were run using their default parameter settings. The Y-axis represents the trait variance explained (R2) by the PRS generated from each software program, while the X-axis corresponds to the number of causal SNPs for the simulated trait. The horizontal line within boxes corresponds to the median values, while the lower and upper hinges correspond to the lower and upper quartiles, respectively, and the lines extend to the minimum and maximum values if those lie within 1.5 times the inter-quartile range (IQR); if not, then they extend to 1.5 times the IQR. Full results of the comparison study are shown in Supplementary Fig. 2.

References

    1. Mavaddat N, Pharoah PDP, Michailidou K, et al. .. Prediction of breast cancer risk based on profiling with common genetic variants. J Natl Cancer Inst. 2015;107(5), doi:10.1093/jnci/djv036. - DOI - PMC - PubMed
    1. Kuchenbaecker KB, McGuffog L, Barrowdale D, et al. .. Evaluation of polygenic risk scores for breast and ovarian cancer risk prediction in BRCA1 and BRCA2 mutation carriers. J Natl Cancer Inst. 2017;109(7), doi:10.1093/jnci/djw302. - DOI - PMC - PubMed
    1. Natarajan P, Young R, Stitziel NO, et al. .. Polygenic risk score identifies subgroup with higher burden of atherosclerosis and greater relative benefit from statin therapy in the primary prevention setting. Circulation. 2017;135(22):2091–101. - PMC - PubMed
    1. Udler MS, Kim J, von Grotthuss M, et al. .. Clustering of type 2 diabetes genetic loci by multi-trait associations identifies disease mechanisms and subtypes. bioRxiv. 2018, doi:10.1101/319509. - DOI - PMC - PubMed
    1. Krapohl E, Euesden J, Zabaneh D, et al. .. Phenome-wide analysis of genome-wide polygenic scores. Mol Psychiatry. 2016;21:1188–93. - PMC - PubMed

Publication types