

Cancer cachexia induces morphological and inflammatory changes in the intestinal mucosa
- PMID: 31307125
- PMCID: PMC6818537
- DOI: 10.1002/jcsm.12449
Cancer cachexia induces morphological and inflammatory changes in the intestinal mucosa
Abstract
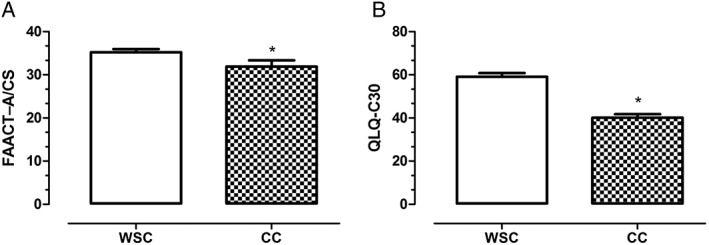
Background: Cachexia is a multifactorial and multiorgan syndrome associated with cancer and other chronic diseases and characterized by severe involuntary body weight loss, disrupted metabolism, inflammation, anorexia, fatigue, and diminished quality of life. This syndrome affects around 50% of patients with colon cancer and is directly responsible for the death of at least 20% of all cancer patients. Systemic inflammation has been recently proposed to underline most of cachexia-related symptoms. Nevertheless, the exact mechanisms leading to the initiation of systemic inflammation have not yet been unveiled, as patients bearing the same tumour and disease stage may or may not present cachexia. We hypothesize a role for gut barrier disruption, which may elicit persistent immune activation in the host. To address this hypothesis, we analysed the healthy colon tissue, adjacent to the tumour.
Methods: Blood and rectosigmoid colon samples (20 cm distal to tumour margin) obtained during surgery, from cachectic (CC = 25) or weight stable (WSC = 20) colon cancer patients, who signed the informed consent form, were submitted to morphological (light microscopy), immunological (immunohistochemistry and flow cytometry), and molecular (quantification of inflammatory factors by Luminex® xMAP) analyses.
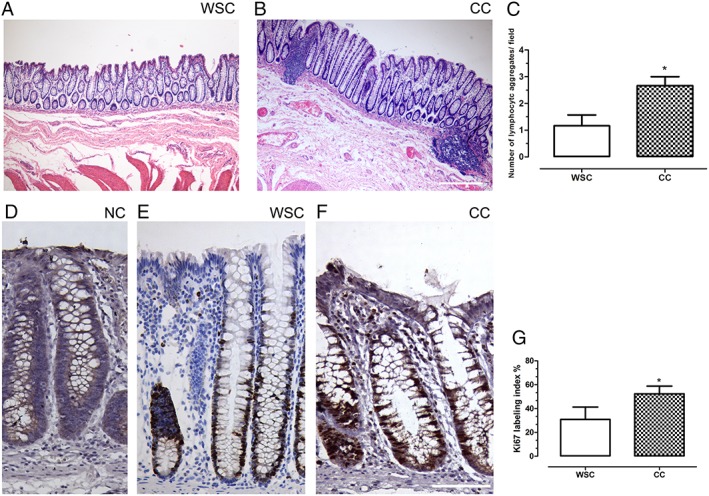
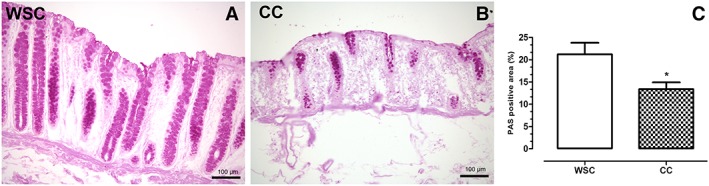
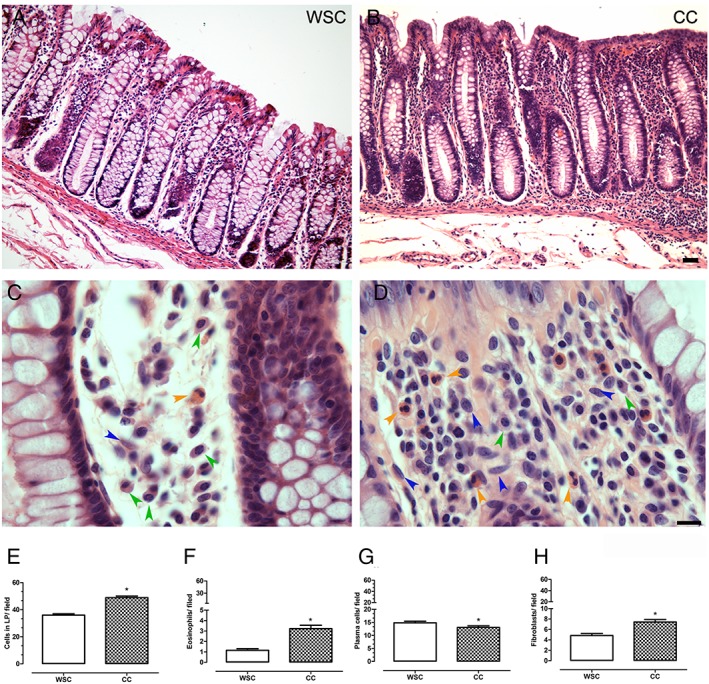
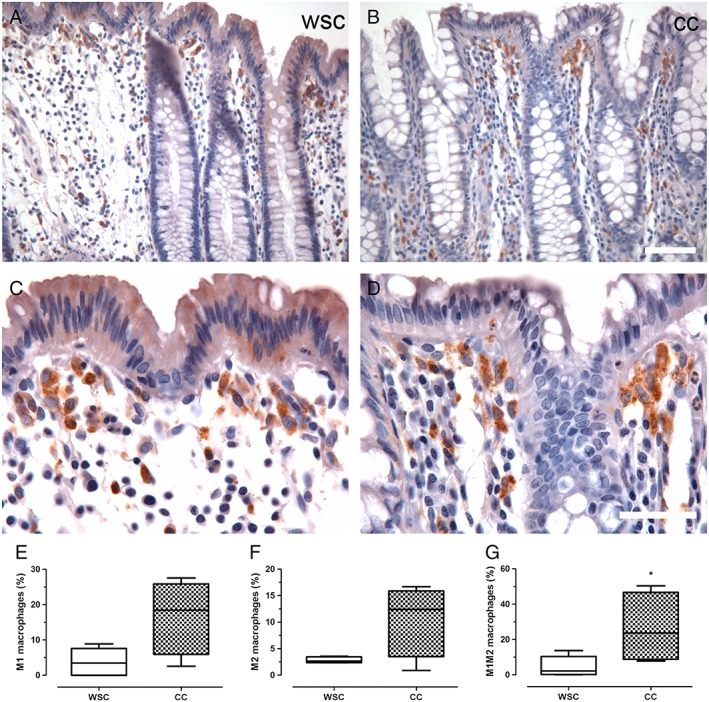
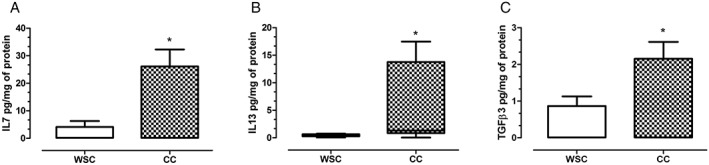
Results: There was no statistical difference in gender and age between groups. The content of plasma interleukin 6 (IL-6) and IL-8 was augmented in cachectic patients relative to those with stable weight (P = 0.047 and P = 0.009, respectively). The number of lymphocytic aggregates/field in the gut mucosa was higher in CC than in WSC (P = 0.019), in addition to those of the lamina propria (LP) eosinophils (P < 0.001) and fibroblasts (P < 0.001). The area occupied by goblet cells in the colon mucosa was decreased in CC (P = 0.016). The M1M2 macrophages percentage was increased in the colon of CC, in relation to WSC (P = 0.042). Protein expression of IL-7, IL-13, and transforming growth factor beta 3 in the colon was significantly increased in CC, compared with WSC (P = 0.02, P = 0.048, and P = 0.048, respectively), and a trend towards a higher content of granulocyte-colony stimulating factor in CC was also observed (P = 0.061). The results suggest an increased recruitment of immune cells to the colonic mucosa in CC, as compared with WSC, in a fashion that resembles repair response following injury, with higher tissue content of IL-13 and transforming growth factor beta 3.
Conclusions: The changes in the intestinal mucosa cellularity, along with modified cytokine expression in cachexia, indicate that gut barrier alterations are associated with the syndrome.
Keywords: Cancer cachexia; Colon cancer; Gut barrier; Inflammation; Intestine.
© 2019 The Authors. Journal of Cachexia, Sarcopenia and Muscle published by John Wiley & Sons Ltd on behalf of the Society on Sarcopenia, Cachexia and Wasting Disorders.
Conflict of interest statement
The authors declare that they have no conflict of interest.
Figures
Similar articles
-
Tumour-derived transforming growth factor-β signalling contributes to fibrosis in patients with cancer cachexia.J Cachexia Sarcopenia Muscle. 2019 Oct;10(5):1045-1059. doi: 10.1002/jcsm.12441. Epub 2019 Jul 4. J Cachexia Sarcopenia Muscle. 2019. PMID: 31273954 Free PMC article.
-
Peritumoural adipose tissue pro-inflammatory cytokines are associated with tumoural growth factors in cancer cachexia patients.J Cachexia Sarcopenia Muscle. 2018 Dec;9(6):1101-1108. doi: 10.1002/jcsm.12345. Epub 2018 Oct 3. J Cachexia Sarcopenia Muscle. 2018. PMID: 30284380 Free PMC article.
-
Cachexia causes time-dependent activation of the inflammasome in the liver.J Cachexia Sarcopenia Muscle. 2023 Aug;14(4):1621-1630. doi: 10.1002/jcsm.13236. Epub 2023 May 12. J Cachexia Sarcopenia Muscle. 2023. PMID: 37177862 Free PMC article.
-
The Role of Tumor Microenvironment Cells in Colorectal Cancer (CRC) Cachexia.Int J Mol Sci. 2021 Feb 4;22(4):1565. doi: 10.3390/ijms22041565. Int J Mol Sci. 2021. PMID: 33557173 Free PMC article. Review.
-
Advances in cancer cachexia: Intersection between affected organs, mediators, and pharmacological interventions.Biochim Biophys Acta Rev Cancer. 2020 Apr;1873(2):188359. doi: 10.1016/j.bbcan.2020.188359. Epub 2020 Mar 25. Biochim Biophys Acta Rev Cancer. 2020. PMID: 32222610 Free PMC article. Review.
Cited by
-
Role of Serum Interleukin-6, Interleukin-1β and Interleukin-10 in Assessment of Disease Activity and Nutritional Status in Patients with Inflammatory Bowel Disease.J Clin Med. 2023 Sep 13;12(18):5956. doi: 10.3390/jcm12185956. J Clin Med. 2023. PMID: 37762896 Free PMC article.
-
Effects of auricular acupuncture on appetite in patients with advanced cancer: a pilot randomized controlled trial.Ann Palliat Med. 2020 Jul;9(4):1804-1811. doi: 10.21037/apm.2020.04.24. Epub 2020 Apr 27. Ann Palliat Med. 2020. PMID: 32389019 Free PMC article. Clinical Trial.
-
Unveiling the role of interleukin-6 in pancreatic cancer occurrence and progression.Front Endocrinol (Lausanne). 2024 May 17;15:1408312. doi: 10.3389/fendo.2024.1408312. eCollection 2024. Front Endocrinol (Lausanne). 2024. PMID: 38828409 Free PMC article. Review.
-
High-Fat Diet Induces Disruption of the Tight Junction-Mediated Paracellular Barrier in the Proximal Small Intestine Before the Onset of Type 2 Diabetes and Endotoxemia.Dig Dis Sci. 2021 Oct;66(10):3359-3374. doi: 10.1007/s10620-020-06664-x. Epub 2020 Oct 26. Dig Dis Sci. 2021. PMID: 33104937
-
IL-6 promotes tumor growth through immune evasion but is dispensable for cachexia.EMBO Rep. 2024 Jun;25(6):2592-2609. doi: 10.1038/s44319-024-00144-3. Epub 2024 Apr 26. EMBO Rep. 2024. PMID: 38671295 Free PMC article.
References
-
- Evans WJ, Morley JE, Argilés J, Bales C, Baracos V, Guttridge D, et al. Cachexia: a new definition. Clin Nutr 2008;27:793–799. - PubMed
-
- Laviano A, Seelaender M, Rianda S, Silverio R, Rossi Fanelli F. Neuroinflammation: a contributing factor to the pathogenesis of cancer cachexia. Crit Rev Oncog 2012;17:247–252. - PubMed
-
- Argilés JM, Busquets S, Stemmler B, López‐Soriano FJ. Cancer cachexia: understanding the molecular basis. Nat Rev Cancer 2014;14:754–762. - PubMed
Publication types
MeSH terms
Substances
Grants and funding
LinkOut - more resources
Full Text Sources
