. 2020 Jun;40(6):1351-1362.
doi: 10.1177/0271678X19864081. Epub 2019 Jul 15.

Validation and noninvasive kinetic modeling of [11C]UCB-J PET imaging in mice

Affiliations

Validation and noninvasive kinetic modeling of [11C]UCB-J PET imaging in mice

Daniele Bertoglio et al. J Cereb Blood Flow Metab. 2020 Jun.

Abstract

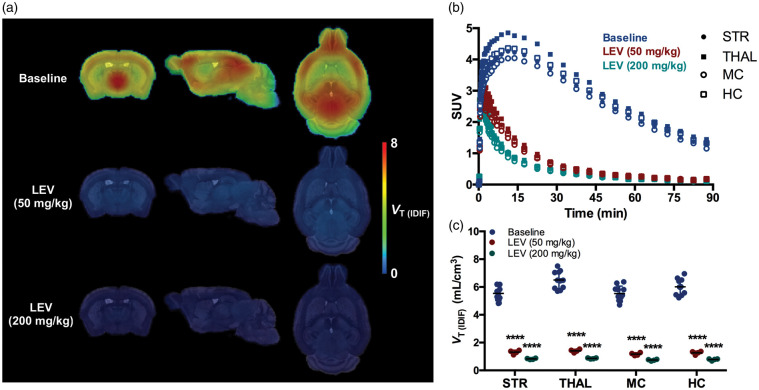
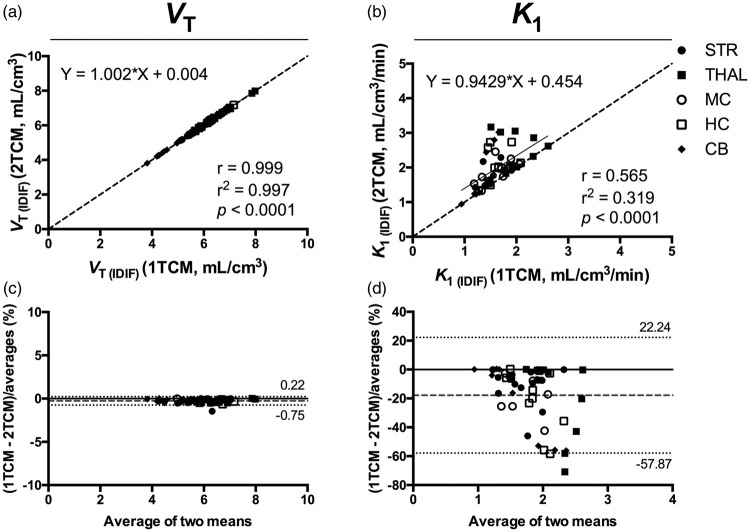
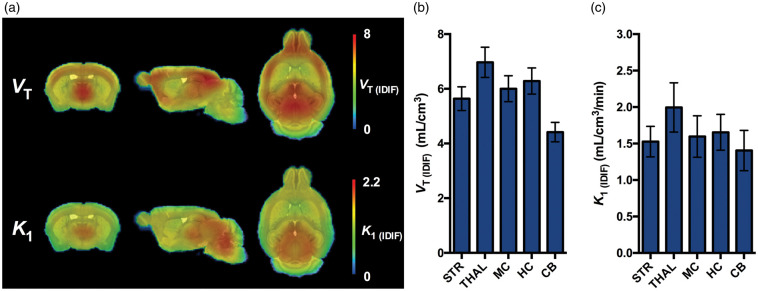
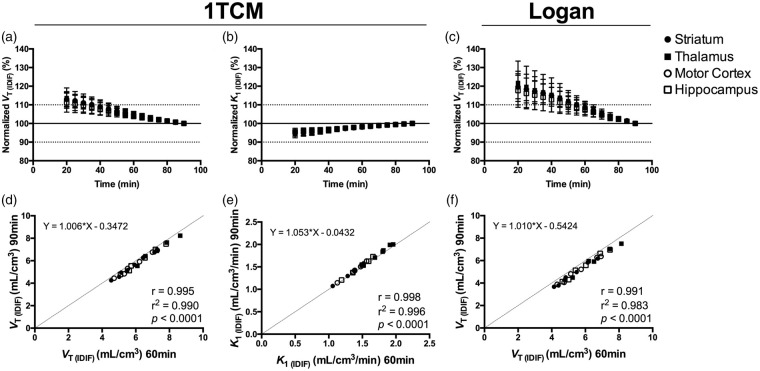
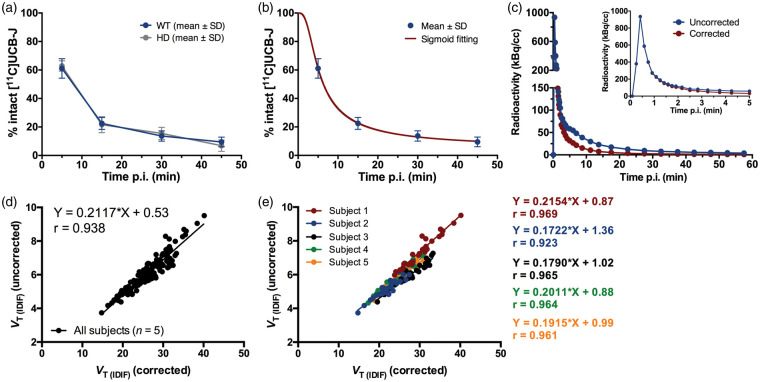
Synaptic pathology is associated with several brain disorders, thus positron emission tomography (PET) imaging of synaptic vesicle glycoprotein 2A (SV2A) using the radioligand [11C]UCB-J may provide a tool to measure synaptic alterations. Given the pivotal role of mouse models in understanding neuropsychiatric and neurodegenerative disorders, this study aims to validate and characterize [11C]UCB-J in mice. We performed a blocking study to verify the specificity of the radiotracer to SV2A, examined kinetic models using an image-derived input function (IDIF) for quantification of the radiotracer, and investigated the in vivo metabolism. Regional TACs during baseline showed rapid uptake of [11C]UCB-J into the brain. Pretreatment with levetiracetam confirmed target engagement in a dose-dependent manner. VT (IDIF) values estimated with one- and two-tissue compartmental models (1TCM and 2TCM) were highly comparable (r=0.999, p < 0.0001), with 1TCM performing better than 2TCM for K1 (IDIF). A scan duration of 60 min was sufficient for reliable VT (IDIF) and K1 (IDIF) estimations. In vivo metabolism of [11C]UCB-J was relatively rapid, with a parent fraction of 22.5 ± 4.2% at 15 min p.i. In conclusion, our findings show that [11C]UCB-J selectively binds to SV2A with optimal kinetics in the mouse representing a promising tool to noninvasively quantify synaptic density in comparative or therapeutic studies in neuropsychiatric and neurodegenerative disorder models.

Keywords: Animal models; SV2A; kinetic modeling; positron emission tomography; synaptic density.


Figures

Figure 1.
Figure 1.
Validation of [11C]UCB-J binding in the mouse brain. (a) Effect of blockade with levetiracetam (LEV) on [11C]UCB-J uptake in WT mice. Parametric microPET images are overlaid onto a MRI mouse brain template for anatomical localization. (b) SUV time-activity curves in four brain regions during baseline and pretreatment with levetiracetam for a 90-min acquisition. (c) VT (IDIF) (Logan) quantification during blockade resulted in a statistically significant reduced values in all investigated regions compared to baseline. ****p < 0.0001. Baseline: n = 10; LEV: n = 4 per dose. STR: striatum; THAL: thalamus; MC: motor cortex; HC: hippocampus; VT (IDIF): total volume of distribution using IDIF.
Figure 2.
Figure 2.
Comparison of the total volume of distribution (VT) and K1 values determined using 1TCM and 2TCM based on IDIF. Correlation of the VT (IDIF) (a) and K1 (IDIF) (b) values calculated using 1TCM and 2TCM based on 90-min acquisition. The solid line represents the linear regression, while the dashed line depicts the identity line. (c and d) Bland–Altman plot to compare 1TCM and 2TCM in estimation of VT (IDIF) and K1 (IDIF), respectively. Dashed line represents the bias between the two approaches, while the dotted lines denote the 95% limits of agreement. n = 10. Each symbol represents a different region. 1TCM: one-tissue compartmental model; 2TCM: two-tissue compartmental model; VT (IDIF): total volume of distribution using IDIF.
Figure 3.
Figure 3.
[11C]UCB-J PET imaging in the mouse brain. (a) Average microPET parametric images for VT (IDIF) and K1 (IDIF) of [11C]UCB-J in healthy WT mice using 1TCM over 90-min acquisition. Parametric microPET images are overlaid onto a MRI mouse brain template for anatomical localization. (b) Regional [11C]UCB-J VT (IDIF) values. (c) Regional [11C]UCB-J K1 (IDIF) values. n = 10. 1TCM: one-tissue compartmental model; VT (IDIF) : total volume of distribution using IDIF; STR: striatum; TH: thalamus; MC: motor cortex; HC: hippocampus; CB: cerebellum.
Figure 4.
Figure 4.
Time stability of the outcome parameters in different brain regions. VT (IDIF) and K1 (IDIF) calculated using 1TCM (a and b) and VT (IDIF) based on Logan plot (c) normalized to the values obtained during 90-min acquisition. Correlations of the outcome parameters VT (IDIF) and K1 (IDIF) calculated using 1TCM (d and e) and VT (IDIF) based on Logan plot (f) when shortening the acquisition time from 90 to 60 min. n = 10. 1TCM = one-tissue compartmental model, VT (IDIF) = total volume of distribution using IDIF.
Figure 5.
Figure 5.
Population-based plasma metabolism of [11C]UCB-J in mice. (a) Population-based curve of intact [11C]UCB-J in plasma of healthy wild-type (WT) and diseased (model of Huntington's disease, HD) mice. n = 3 per genotype at each time point. (b) Sigmoid fitting curve of the intact [11C]UCB-J in WT mice. (c) Comparison of representative image-derived input functions (IDIF) corrected and uncorrected for the population-based sigmoid fitting of intact [11C]UCB-J. Scatter plots between VT (IDIF) (Logan) corrected and uncorrected for the population-based sigmoid fitting of intact [11C]UCB-J based on a total of five WT mice (d) and correlations for each individual WT mouse (e) in different brain regions. Individual animals presented different regression line equations.

References

    1. Jahn R, Fasshauer D. Molecular machines governing exocytosis of synaptic vesicles. Nature 2012; 490: 201–207. - PMC - PubMed
    1. Nowack A, Yao J, Custer KL, et al.SV2 regulates neurotransmitter release via multiple mechanisms. Am J Physiol Cell Physiol 2010; 299: C960–967. - PMC - PubMed
    1. Bajjalieh SM, Frantz GD, Weimann JM, et al.Differential expression of synaptic vesicle protein 2 (SV2) isoforms. J Neurosci 1994; 14: 5223–5235. - PMC - PubMed
    1. Janz R, Sudhof TC. SV2C is a synaptic vesicle protein with an unusually restricted localization: anatomy of a synaptic vesicle protein family. Neuroscience 1999; 94: 1279–1290. - PubMed
    1. Bajjalieh SM, Peterson K, Linial M, et al.Brain contains two forms of synaptic vesicle protein 2. Proc Natl Acad Sci U S A 1993; 90: 2150–2154. - PMC - PubMed

Publication types

Substances

LinkOut - more resources