

PhenPath: a tool for characterizing biological functions underlying different phenotypes
- PMID: 31307376
- PMCID: PMC6631446
- DOI: 10.1186/s12864-019-5868-x
PhenPath: a tool for characterizing biological functions underlying different phenotypes
Abstract
Background: Many diseases are associated with complex patterns of symptoms and phenotypic manifestations. Parsimonious explanations aim at reconciling the multiplicity of phenotypic traits with the perturbation of one or few biological functions. For this, it is necessary to characterize human phenotypes at the molecular and functional levels, by exploiting gene annotations and known relations among genes, diseases and phenotypes. This characterization makes it possible to implement tools for retrieving functions shared among phenotypes, co-occurring in the same patient and facilitating the formulation of hypotheses about the molecular causes of the disease.
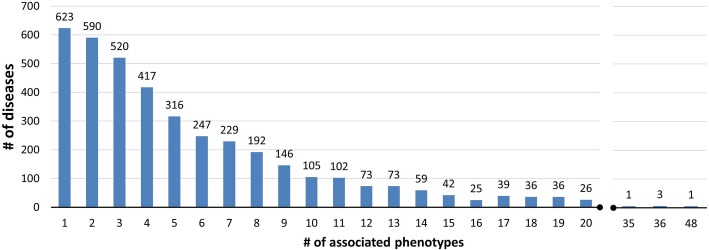
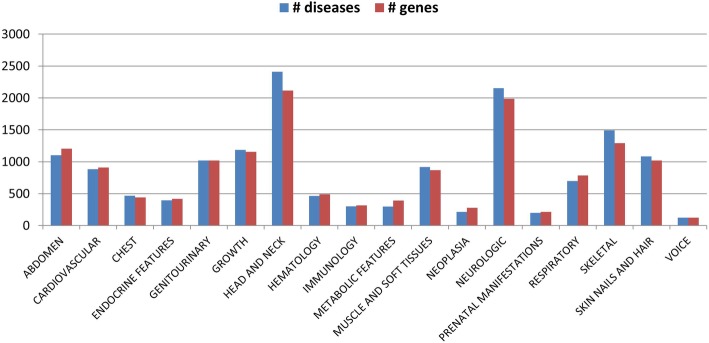
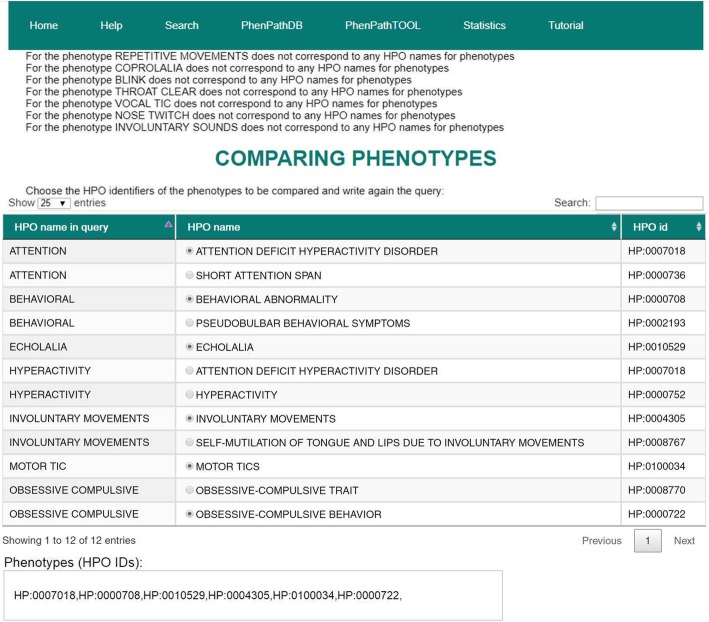
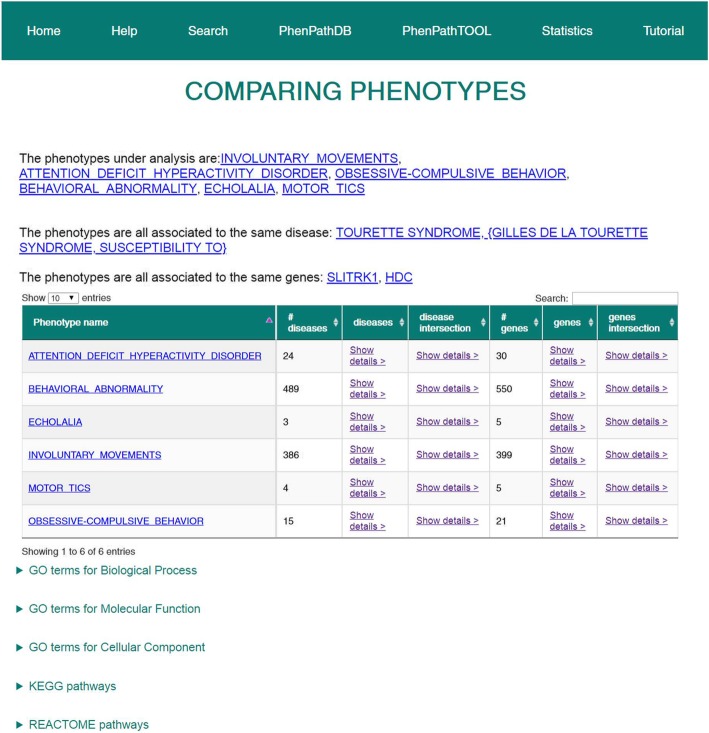
Results: We introduce PhenPath, a new resource consisting of two parts: PhenPathDB and PhenPathTOOL. The former is a database collecting the human genes associated with the phenotypes described in Human Phenotype Ontology (HPO) and OMIM Clinical Synopses. Phenotypes are then associated with biological functions and pathways by means of NET-GE, a network-based method for functional enrichment of sets of genes. The present version considers only phenotypes related to diseases. PhenPathDB collects information for 18 OMIM Clinical synopses and 7137 HPO phenotypes, related to 4292 diseases and 3446 genes. Enrichment of Gene Ontology annotations endows some 87.7, 86.9 and 73.6% of HPO phenotypes with Biological Process, Molecular Function and Cellular Component terms, respectively. Furthermore, 58.8 and 77.8% of HPO phenotypes are also enriched for KEGG and Reactome pathways, respectively. Based on PhenPathDB, PhenPathTOOL analyzes user-defined sets of phenotypes retrieving diseases, genes and functional terms which they share. This information can provide clues for interpreting the co-occurrence of phenotypes in a patient.
Conclusions: The resource allows finding molecular features useful to investigate diseases characterized by multiple phenotypes, and by this, it can help researchers and physicians in identifying molecular mechanisms and biological functions underlying the concomitant manifestation of phenotypes. The resource is freely available at http://phenpath.biocomp.unibo.it .
Keywords: Biological process; Diseases; Enrichment; Molecular pathway; Phenotype.
Conflict of interest statement
The authors declare that they have no competing interests.
Figures

References
MeSH terms
LinkOut - more resources
Full Text Sources
