

What makes a bad egg? Egg transcriptome reveals dysregulation of translational machinery and novel fertility genes important for fertilization
- PMID: 31307377
- PMCID: PMC6631549
- DOI: 10.1186/s12864-019-5930-8
What makes a bad egg? Egg transcriptome reveals dysregulation of translational machinery and novel fertility genes important for fertilization
Abstract
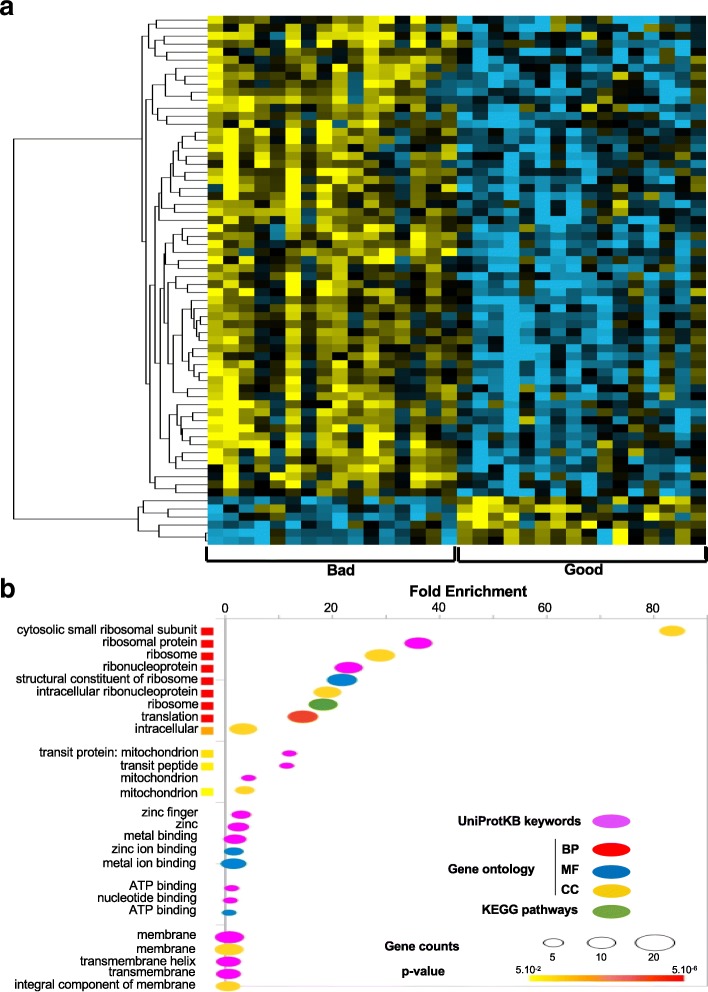
Background: Egg quality can be defined as the egg ability to be fertilized and subsequently develop into a normal embryo. Previous research has shed light on factors that can influence egg quality. Large gaps however remain including a comprehensive view of what makes a bad egg. Initial development of the embryo relies on maternally-inherited molecules, such as transcripts, deposited in the egg during its formation. Bad egg quality is therefore susceptible to be associated with alteration or dysregulation of maternally-inherited transcripts. We performed transcriptome analysis on a large number (N = 136) of zebrafish egg clutches, each clutch being split to monitor developmental success and perform transcriptome analysis in parallel. We aimed at drawing a molecular portrait of the egg in order to characterize the relation between egg transcriptome and developmental success and to subsequently identify new candidate genes involved in fertility.
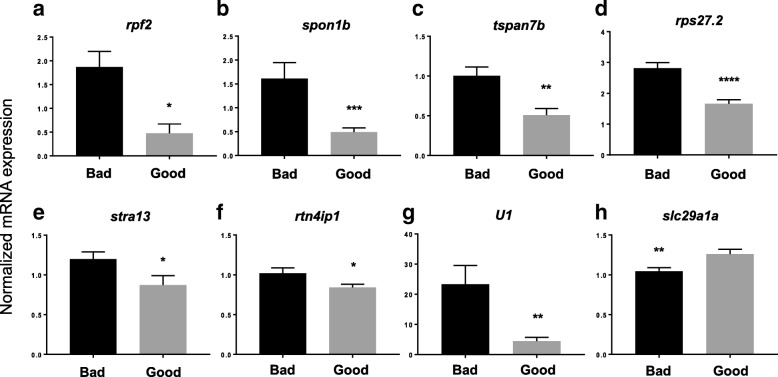
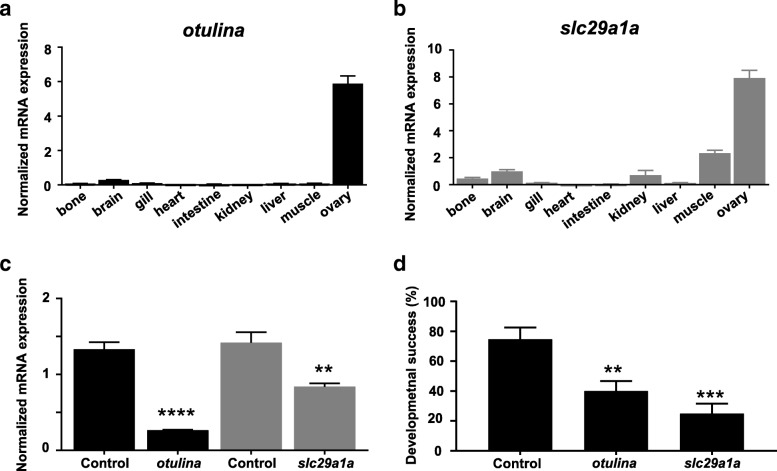
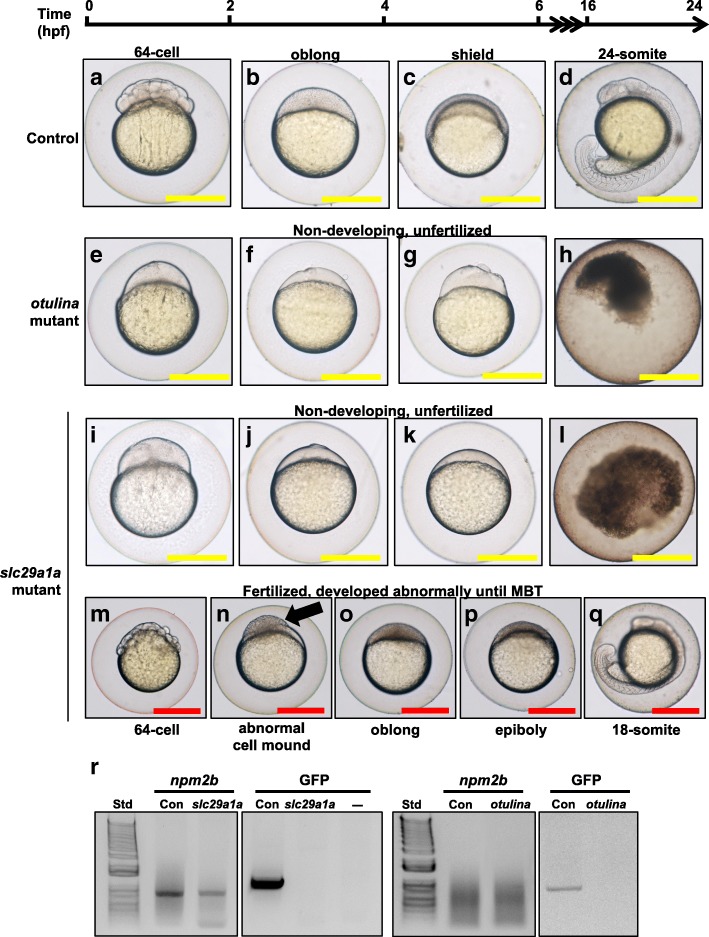
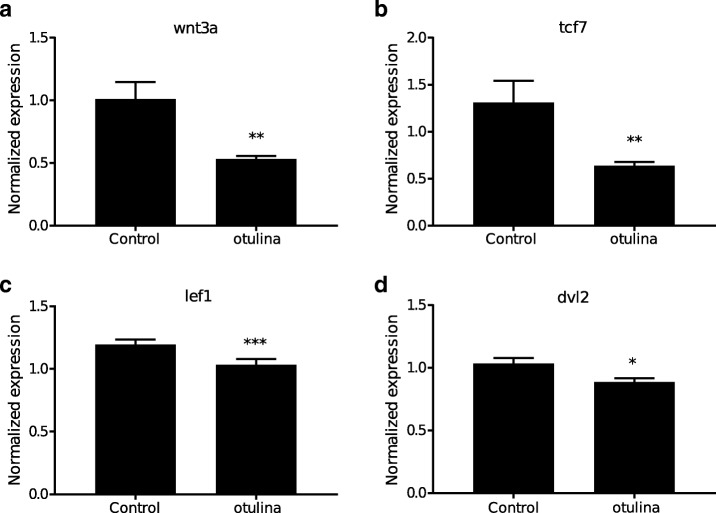
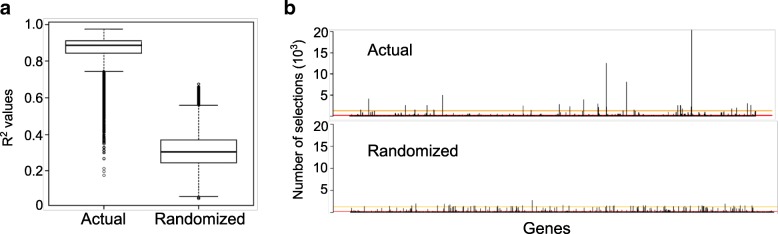
Results: We identified 66 transcript that were differentially abundant in eggs of contrasted phenotype (low or high developmental success). Statistical modeling using partial least squares regression and genetics algorithm demonstrated that gene signatures from transcriptomic data can be used to predict developmental success. The identity and function of differentially expressed genes indicate a major dysregulation of genes of the translational machinery in poor quality eggs. Two genes, otulina and slc29a1a, predominantly expressed in the ovary and dysregulated in poor quality eggs were further investigated using CRISPR/Cas9 mediated genome editing. Mutants of each gene revealed remarkable subfertility whereby the majority of their eggs were unfertilizable. The Wnt pathway appeared to be dysregulated in the otulina mutant-derived eggs.
Conclusions: Here we show that egg transcriptome contains molecular signatures, which can be used to predict developmental success. Our results also indicate that poor egg quality in zebrafish is associated with a dysregulation of (i) the translational machinery genes and (ii) novel fertility genes, otulina and slc29a1a, playing an important role for fertilization. Together, our observations highlight the diversity of the possible causes of egg quality defects and reveal mechanisms of maternal origin behind the lack of fertilization and early embryonic failures that can occur under normal reproduction conditions.
Keywords: Differentially expressed genes; Egg quality; Microarray; Prediction model; Transcriptome; Zebrafish.
Conflict of interest statement
The authors declare that there are no competing interests.
Figures
Similar articles
-
Variation in embryonic mortality and maternal transcript expression among Atlantic cod (Gadus morhua) broodstock: a functional genomics study.Mar Genomics. 2014 Dec;18 Pt A:3-20. doi: 10.1016/j.margen.2014.05.004. Epub 2014 May 28. Mar Genomics. 2014. PMID: 24878168
-
Maternally inherited npm2 mRNA is crucial for egg developmental competence in zebrafish.Biol Reprod. 2014 Aug;91(2):43. doi: 10.1095/biolreprod.114.119925. Epub 2014 Jul 9. Biol Reprod. 2014. PMID: 25009208
-
[Mechanisms of the Effect of Maternal Age-Related Oocyte Aging on Fertility: Transcriptomic Sequencing Analysis of a Zebrafish Model].Sichuan Da Xue Xue Bao Yi Xue Ban. 2024 May 20;55(3):588-595. doi: 10.12182/20240560205. Sichuan Da Xue Xue Bao Yi Xue Ban. 2024. PMID: 38948296 Free PMC article. Chinese.
-
Retrospective analysis: reproducibility of interblastomere differences of mRNA expression in 2-cell stage mouse embryos is remarkably poor due to combinatorial mechanisms of blastomere diversification.Mol Hum Reprod. 2018 Jul 1;24(7):388-400. doi: 10.1093/molehr/gay021. Mol Hum Reprod. 2018. PMID: 29746690
-
Transcriptomics of mRNA and egg quality in farmed fish: Some recent developments and future directions.Gen Comp Endocrinol. 2015 Sep 15;221:23-30. doi: 10.1016/j.ygcen.2015.02.012. Epub 2015 Feb 26. Gen Comp Endocrinol. 2015. PMID: 25725305 Review.
Cited by
-
Zebrafish Ski7 tunes RNA levels during the oocyte-to-embryo transition.PLoS Genet. 2021 Feb 18;17(2):e1009390. doi: 10.1371/journal.pgen.1009390. eCollection 2021 Feb. PLoS Genet. 2021. PMID: 33600438 Free PMC article.
-
Comparisons among rainbow trout, Oncorhynchus mykiss, populations of maternal transcript profile associated with egg viability.BMC Genomics. 2021 Jun 15;22(1):448. doi: 10.1186/s12864-021-07773-1. BMC Genomics. 2021. PMID: 34130620 Free PMC article.
-
Improving the sexual activity and reproduction of female zebrafish with high testosterone levels.Sci Rep. 2021 Feb 15;11(1):3822. doi: 10.1038/s41598-021-83085-4. Sci Rep. 2021. PMID: 33589678 Free PMC article.
-
The X-linked acrogigantism-associated gene gpr101 is a regulator of early embryonic development and growth in zebrafish.Mol Cell Endocrinol. 2021 Jan 15;520:111091. doi: 10.1016/j.mce.2020.111091. Epub 2020 Nov 26. Mol Cell Endocrinol. 2021. PMID: 33248229 Free PMC article.
-
Quality of fish eggs and production of androgenetic and gynogenetic doubled haploids (DHs).Fish Physiol Biochem. 2024 Oct;50(5):1947-1957. doi: 10.1007/s10695-023-01206-4. Epub 2023 Jun 10. Fish Physiol Biochem. 2024. PMID: 37296321 Free PMC article. Review.
References
-
- Wagner DS, Dosch R, Mintzer KA, Wiemelt AP, Mullins MC. Maternal control of development at the midblastula transition and beyond. mutants from the zebrafish II Dev Cell. 2004;6:781–790. - PubMed
MeSH terms
Grants and funding
LinkOut - more resources
Full Text Sources
Molecular Biology Databases
Research Materials
