Stochastic modeling of aging cells reveals how damage accumulation, repair, and cell-division asymmetry affect clonal senescence and population fitness
- PMID: 31307385
- PMCID: PMC6631810
- DOI: 10.1186/s12859-019-2921-3
Stochastic modeling of aging cells reveals how damage accumulation, repair, and cell-division asymmetry affect clonal senescence and population fitness
Abstract
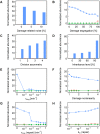
Background: Asymmetry during cellular division, both in the uneven partitioning of damaged cellular components and of cell volume, is a cell biological phenomenon experienced by many unicellular organisms. Previous work based on a deterministic model claimed that such asymmetry in the partitioning of cell volume and of aging-associated damage confers a fitness benefit in avoiding clonal senescence, primarily by diversifying the cellular population. However, clonal populations of unicellular organisms are already naturally diversified due to the inherent stochasticity of biological processes.
Results: Applying a model of aging cells that accounts for natural cell-to-cell variations across a broad range of parameter values, here we show that the parameters directly controlling the accumulation and repair of damage are the most important factors affecting fitness and clonal senescence, while the effects of both segregation of damaged components and division asymmetry are frequently minimal and generally context-dependent.
Conclusions: We conclude that damage segregation and division asymmetry, perhaps counterintuitively, are not necessarily beneficial from an evolutionary perspective.
Conflict of interest statement
The authors declare that they have no competing interests.
Figures


Similar articles
-
Damage Repair versus Aging in an Individual-Based Model of Biofilms.mSystems. 2020 Oct 13;5(5):e00018-20. doi: 10.1128/mSystems.00018-20. mSystems. 2020. PMID: 33051374 Free PMC article.
-
Repair rather than segregation of damage is the optimal unicellular aging strategy.BMC Biol. 2014 Aug 16;12:52. doi: 10.1186/s12915-014-0052-x. BMC Biol. 2014. PMID: 25184818 Free PMC article.
-
Asymmetrical Damage Partitioning in Bacteria: A Model for the Evolution of Stochasticity, Determinism, and Genetic Assimilation.PLoS Comput Biol. 2016 Jan 13;12(1):e1004700. doi: 10.1371/journal.pcbi.1004700. eCollection 2016 Jan. PLoS Comput Biol. 2016. PMID: 26761487 Free PMC article.
-
Asymmetry, division of labour and the evolution of ageing in multicellular organisms.Philos Trans R Soc Lond B Biol Sci. 2021 Apr 26;376(1823):20190729. doi: 10.1098/rstb.2019.0729. Epub 2021 Mar 8. Philos Trans R Soc Lond B Biol Sci. 2021. PMID: 33678014 Free PMC article. Review.
-
The proliferation theory of rejuvenation.Mech Ageing Dev. 1992 Aug;65(1):85-107. doi: 10.1016/0047-6374(92)90127-y. Mech Ageing Dev. 1992. PMID: 1405792 Review.
Cited by
-
Astaxanthin as a Putative Geroprotector: Molecular Basis and Focus on Brain Aging.Mar Drugs. 2020 Jul 5;18(7):351. doi: 10.3390/md18070351. Mar Drugs. 2020. PMID: 32635607 Free PMC article. Review.
-
The choice of the objective function in flux balance analysis is crucial for predicting replicative lifespans in yeast.PLoS One. 2022 Oct 13;17(10):e0276112. doi: 10.1371/journal.pone.0276112. eCollection 2022. PLoS One. 2022. PMID: 36227951 Free PMC article.
-
Balance between asymmetric allocation and repair of somatic damage in unicellular life forms as an ancient form of r/K selection.Proc Natl Acad Sci U S A. 2024 May 28;121(22):e2400008121. doi: 10.1073/pnas.2400008121. Epub 2024 May 24. Proc Natl Acad Sci U S A. 2024. PMID: 38787879 Free PMC article.
-
Computational Systems Biology Approaches to Cellular Aging - Integrating Network Maps and Dynamical Models.Quant Biol. 2025 Dec;13(4):e70007. doi: 10.1002/qub2.70007. Epub 2025 May 26. Quant Biol. 2025. PMID: 40697249
-
Sis2 regulates yeast replicative lifespan in a dose-dependent manner.Nat Commun. 2023 Nov 27;14(1):7719. doi: 10.1038/s41467-023-43233-y. Nat Commun. 2023. PMID: 38012152 Free PMC article.
References
-
- Holliday R. Biology of aging and development. Boston: Springer US; 1975. Growth and death of diploid and transformed human fibroblasts; pp. 97–106. - PubMed
MeSH terms
Grants and funding
LinkOut - more resources
Full Text Sources
Medical
Molecular Biology Databases

