. 2019 Jul 15;20(1):139.
doi: 10.1186/s13059-019-1746-8.

The bread wheat epigenomic map reveals distinct chromatin architectural and evolutionary features of functional genetic elements

Affiliations

The bread wheat epigenomic map reveals distinct chromatin architectural and evolutionary features of functional genetic elements

Zijuan Li et al. Genome Biol. .

Abstract

Background: Bread wheat is an allohexaploid species with a 16-Gb genome that has large intergenic regions, which presents a big challenge for pinpointing regulatory elements and further revealing the transcriptional regulatory mechanisms. Chromatin profiling to characterize the combinatorial patterns of chromatin signatures is a powerful means to detect functional elements and clarify regulatory activities in human studies.

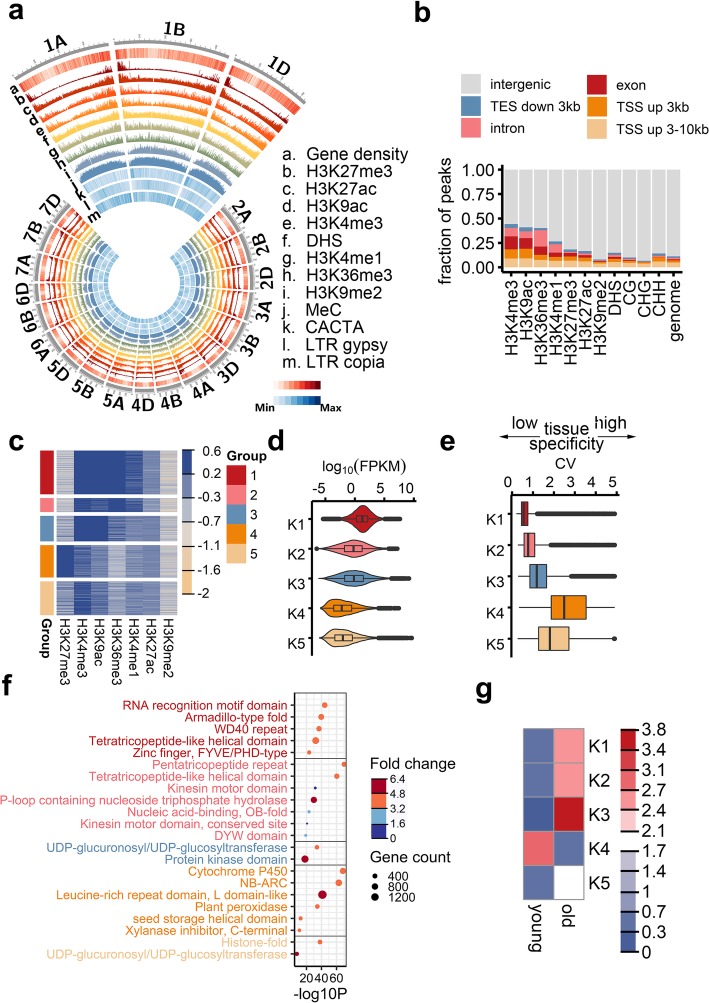
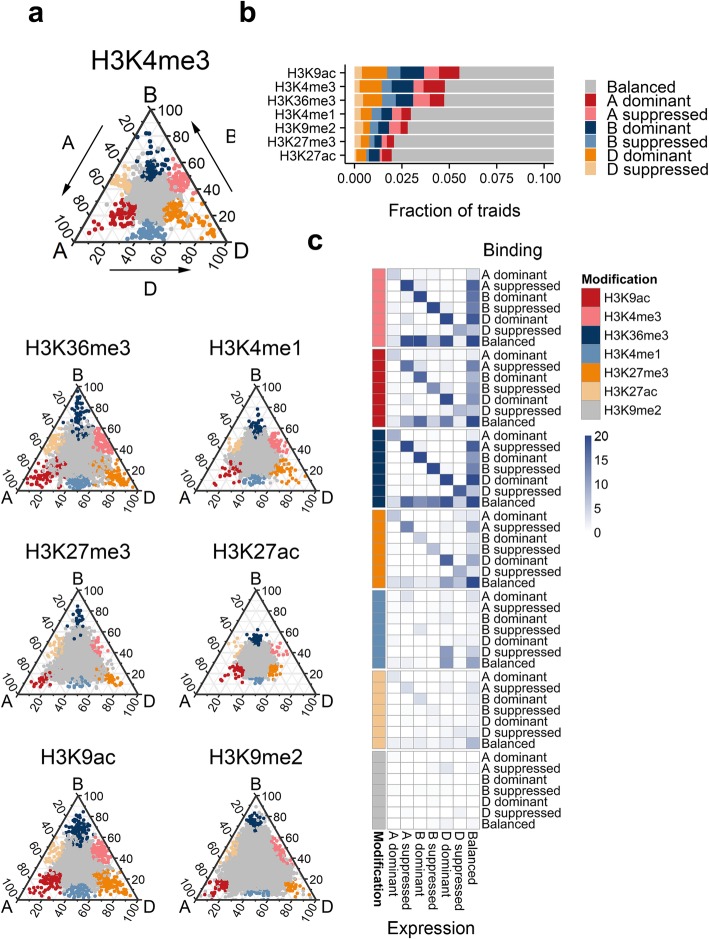
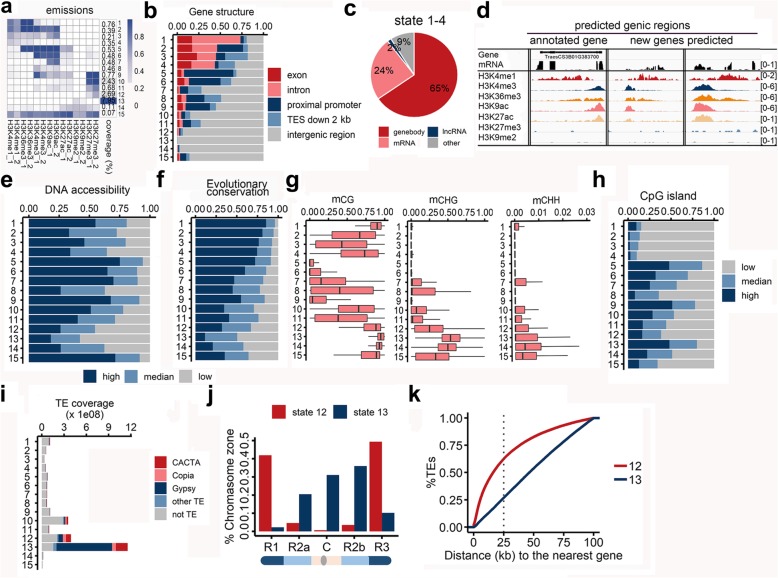
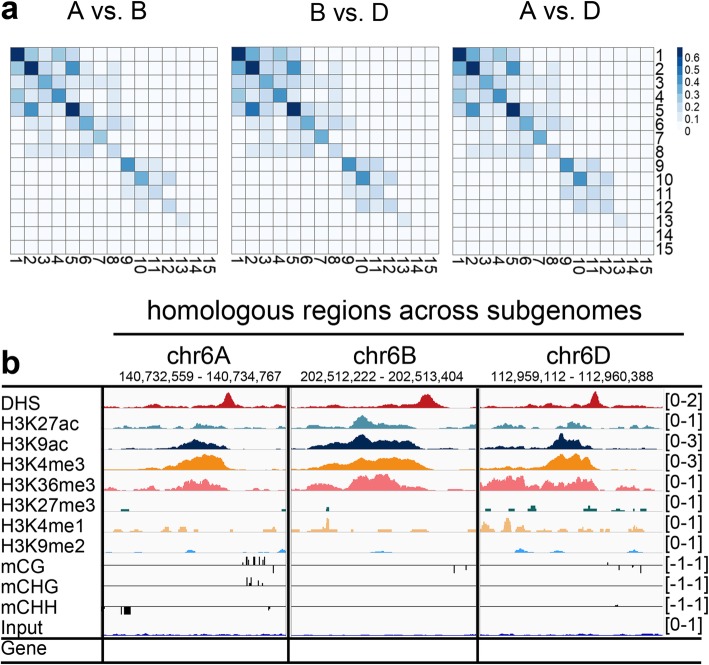
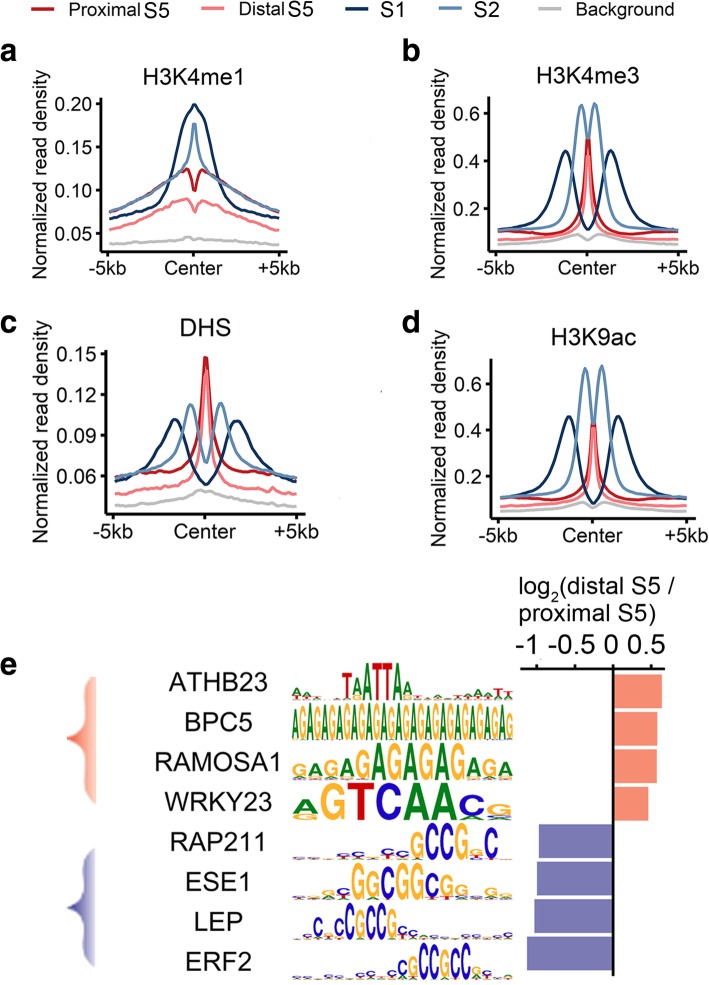
Results: In the present study, through comprehensive analyses of the open chromatin, DNA methylome, seven major chromatin marks, and transcriptomic data generated for seedlings of allohexaploid wheat, we detected distinct chromatin architectural features surrounding various functional elements, including genes, promoters, enhancer-like elements, and transposons. Thousands of new genic regions and cis-regulatory elements are identified based on the combinatorial pattern of chromatin features. Roughly 1.5% of the genome encodes a subset of active regulatory elements, including promoters and enhancer-like elements, which are characterized by a high degree of chromatin openness and histone acetylation, an abundance of CpG islands, and low DNA methylation levels. A comparison across sub-genomes reveals that evolutionary selection on gene regulation is targeted at the sequence and chromatin feature levels. The divergent enrichment of cis-elements between enhancer-like sequences and promoters implies these functional elements are targeted by different transcription factors.

Conclusions: We herein present a systematic epigenomic map for the annotation of cis-regulatory elements in the bread wheat genome, which provides new insights into the connections between chromatin modifications and cis-regulatory activities in allohexaploid wheat.

Keywords: Allohexaploid; Bread wheat; Chromatin signature; Enhancer; Epigenomic map; Promoter; Regulatory element.


Conflict of interest statement

The authors declare that they have no competing interests.

Figures

Fig. 1
Fig. 1
Chromatin profiling revealed the epigenetic regulation of genes. a Circos plot summarizing the chromosomal distribution of epigenetic marks. The outermost circle depicts the ideograms of each chromosome. The second outermost circle represents gene density, with red and white indicating high and low density, respectively. Bar plots in the middle circles present the density of epigenetic marks, including seven histone modifications, DNase I-hypersensitive site (DHS), and DNA methylation levels. The three innermost circles represent the densities of three major transposable elements (TEs) in wheat (CACTA, Gypsy, and Copia). b Peak distribution of each mark surrounding various genomic features. TSS, transcription start site; TES, transcription end site. c Five groups of genes marked by different combinations of epigenetic modifications. The normalized intensity of each mark surrounding genes was recorded for k-means clustering. d Violin plot presenting the distribution of gene expression densities for various groups. e Boxplot presenting the tissue specificity, which is represented by the coefficient of expression variance (CV) across various tissues. The transcriptomic data for seven tissues were published previously [13]. f Top enriched protein families for each gene group ranked based on the enrichment P value. Each circle represents one enriched term. The color intensity of the circle represents the fold enrichment. The size of the circle represents the number of genes in each group with the given term. g Enrichment of each gene group for conserved genes (old) or non-conserved genes (young)
Fig. 2
Fig. 2
Sub-genome-biased promoter binding and regulation of homolog triads by various markers. a Ternary plot presenting the relative binding densities of seven epigenetic marks in the promoters of triad genes. Each circle represents a gene triad. The distance for each triad was determined based on the ratio of the normalized read density for one sub-genome to the read density for all sub-genomes. b Fraction of triads with significantly unbalanced binding across sub-genomes. c Enrichment of the overlap between the biased binding of epigenetic marks and the biased expression of target genes. Dark blue represents a significant overlap. A total of 12,669 expressed triad genes were used
Fig. 3
Fig. 3
Distinctive and predictive chromatin signatures of functional elements. a Chromatin states determined with a multivariate hidden Markov model. The heatmap presents the emission parameters based on genome-wide combinations of epigenetic marks. Dark blue represents a high frequency of a given mark at regions corresponding to the chromatin state. Each row represents one state, and each column represents one chromatin mark, except the last column, which represents the genomic coverage of the given state. Replicates displayed good consistency. b Bar plot indicating the distribution of genomic positions in each state for various genomic features. c Pie plot presenting the fraction of regions in each chromatin state covering mRNA or lncRNA sequencing reads. d Genomic tracks illustrating three predicted genes based on the signatures of chromatin states 1–4. The first gene was annotated according to the IWGSC RefSeq genome assembly (version 1.0), whereas the other two genes were not annotated, but had a high RNA-seq read density. The data in square brackets represent the range of normalized read densities. The number of reads in each position was normalized against the total number of reads (reads per million mapped reads). e, f For each chromatin state, the fractions of open chromatin regions characterized by DHS read density (e) and conservation score across wheat species (f) were calculated. g Boxplot presenting the distribution of DNA methylation ratios of each chromatin state in three sequence contexts. h Fraction of each chromatin state overlapping with a CpG island. i Number of regions in each chromatin state associated with various types of TEs. j Distribution of TEs in various genomic segments associated with distal (R1 and R3) as well as interstitial and proximal (R2 and C) regions in chromatin states 12 and 13. k Cumulative distances of TEs to the nearest genes in chromatin states 12 and 13
Fig. 4
Fig. 4
Conservation of the epigenetic architecture of regulatory elements across sub-genomes. a Pair-wise comparison (Jaccard similarity) of shared chromatin states between sub-genomes (i.e., the fraction of sub-genome collinear regions from each chromatin state sharing the same state between sub-genomes). b. Genomic tracks illustrating the conservation of epigenetic features in the predicted enhancer regions exhibiting sequence collinearity across three sub-genomes. The number of reads in each position was normalized against the total number of reads (reads per million mapped reads)
Fig. 5
Fig. 5
Epigenetic and sequence features of predicted promoters and enhancers. a–d Average profile of H3K4me1 (a), H3K4me3 (b), DHS (c), and H3K9ac (d) read densities surrounding the center of gene-proximal and gene-distal regions in chromatin state 5 (S5) and regions in chromatin states 1 (S1) and 2 (S2) corresponding to gene bodies highly conserved across three sub-genomes. e Cis-elements differentially enriched in the promoter and enhancer-like regions in state 5. The bar plot represents the relative log2 fold-change of the occurrence of corresponding motifs in promoters versus enhancer-like regions
Fig. 6
Fig. 6
Experimental validation of predicted enhancers. a, b The predicted enhancer loci were cloned into pMY155 reporter constructs (a) to examine their regulatory potential based on a luciferase reporter assay (b). Results for the first six predicted regions are presented, and results for the other 26 predicted regions are provided in Additional file 1: Figure S4. c Relative intensity of 26 predicted enhancer-like elements in states 5–7 and six active genic regions in states 1 and 2 in the reporter assay. Two control regions (ctrl) were randomly chosen from genomic regions without any histone modifications characterized in the present study. The order of the region tested is the same with the experimental results shown in Additional file 1: Figure S4 and the quantitative results listed in Additional file 2: Table S5. d Correlation between the relative intensity determined by the reporter assay and the ChIP-sequencing or DNase-sequencing read density in predicted enhancer-like regions of each epigenetic mark. Detailed data are listed in Additional file 2: Table S5. e Scatter plot presenting the correlation between the DHS read density and relative intensity in the reporter assay for the 32 predicted regions. Detailed data are listed in Additional file 2: Table S5

References

    1. International Wheat Genome Sequencing C, investigators IRp, Appels R, Eversole K, Feuillet C, Keller B, Rogers J, Stein N, investigators Iw-gap, Pozniak CJ, et al. Shifting the limits in wheat research and breeding using a fully annotated reference genome. Science. 2018;361:eaar7191. - PubMed
    1. Weber B, Zicola J, Oka R, Stam M. Plant enhancers: a call for discovery. Trends Plant Sci. 2016;21:974–987. doi: 10.1016/j.tplants.2016.07.013. - DOI - PubMed
    1. Ong CT, Corces VG. Enhancer function: new insights into the regulation of tissue-specific gene expression. Nat Rev Genet. 2011;12:283–293. doi: 10.1038/nrg2957. - DOI - PMC - PubMed
    1. Heintzman ND, Stuart RK, Hon G, Fu Y, Ching CW, Hawkins RD, Barrera LO, Van Calcar S, Qu C, Ching KA, et al. Distinct and predictive chromatin signatures of transcriptional promoters and enhancers in the human genome. Nat Genet. 2007;39:311–318. doi: 10.1038/ng1966. - DOI - PubMed
    1. Allis CD, Jenuwein T. The molecular hallmarks of epigenetic control. Nat Rev Genet. 2016;17:487–500. doi: 10.1038/nrg.2016.59. - DOI - PubMed

Publication types