. 2019 Jul 15;38(1):310.
doi: 10.1186/s13046-019-1313-x.

Macrophage-derived exosomal microRNA-501-3p promotes progression of pancreatic ductal adenocarcinoma through the TGFBR3-mediated TGF-β signaling pathway

Affiliations

Macrophage-derived exosomal microRNA-501-3p promotes progression of pancreatic ductal adenocarcinoma through the TGFBR3-mediated TGF-β signaling pathway

Zi Yin et al. J Exp Clin Cancer Res. .

Abstract

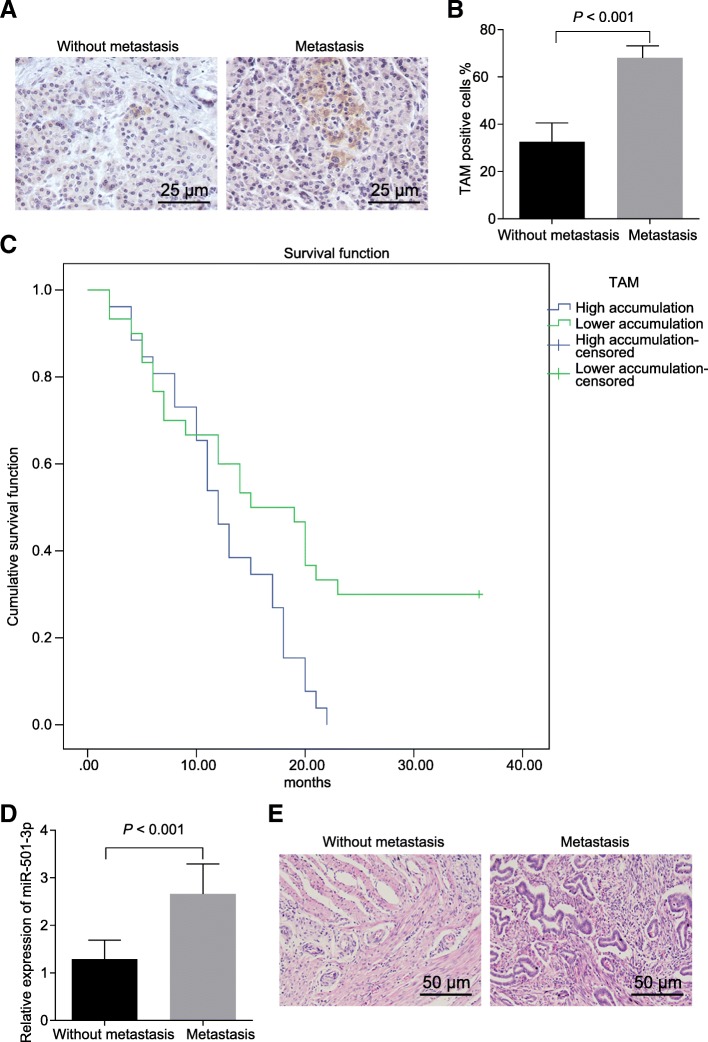
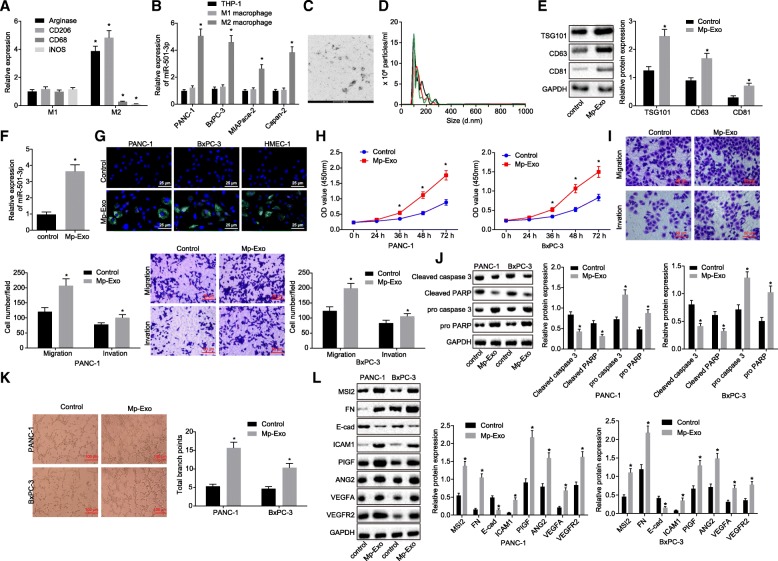
Background: Exosomes from cancer cells or immune cells, carrying bio-macromolecules or microRNAs (miRNAs), participate in tumor pathogenesis and progression by modulating microenvironment. Our study aims to investigate the role of these microRNA-501-3p (miR-501-3p) containing exosomes derived from tumor-associated macrophage (TAM) in the progression of pancreatic ductal adenocarcinoma (PDAC).

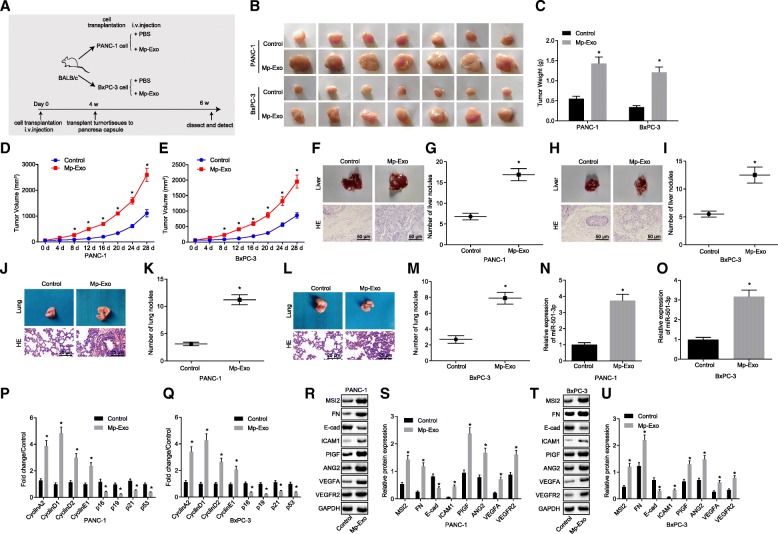
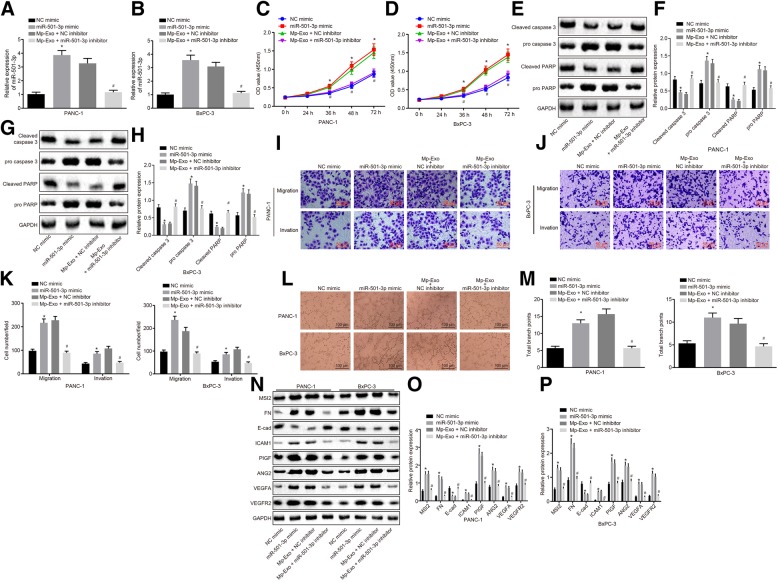
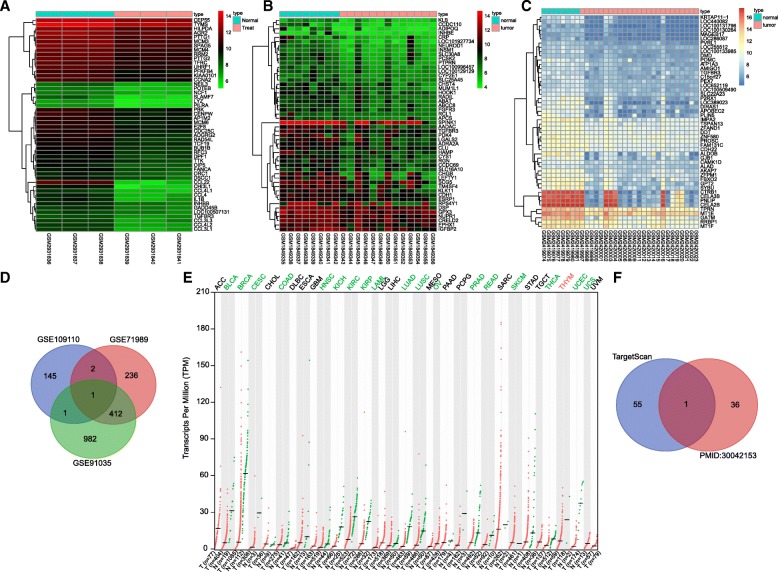
Methods: Firstly, the function of TAM recruitment in PDAC tissues was assessed, followed by identification of the effects of M2 macrophage-derived exosomes on PDAC cell activities and tumor formation and metastasis in mice. In silico analysis was conducted to predict differentially expressed genes and regulatory miRNAs related to PDAC treated with macrophages, which determined miR-501-3p and TGFBR3 for subsequent experiments. Next, gain- and loss-of-function experiments were performed to examine their role in PDAC progression with the involvement of the TGF-β signaling pathway.

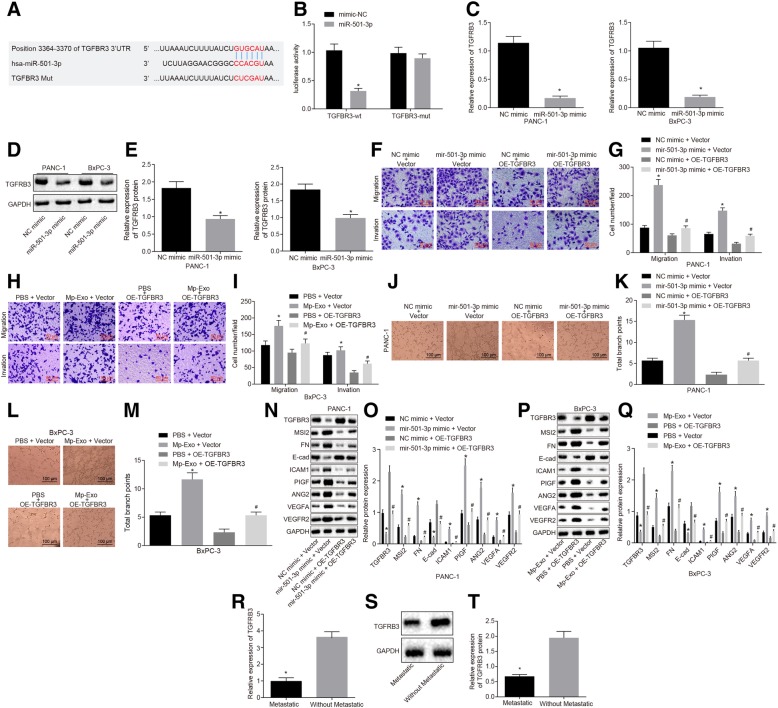
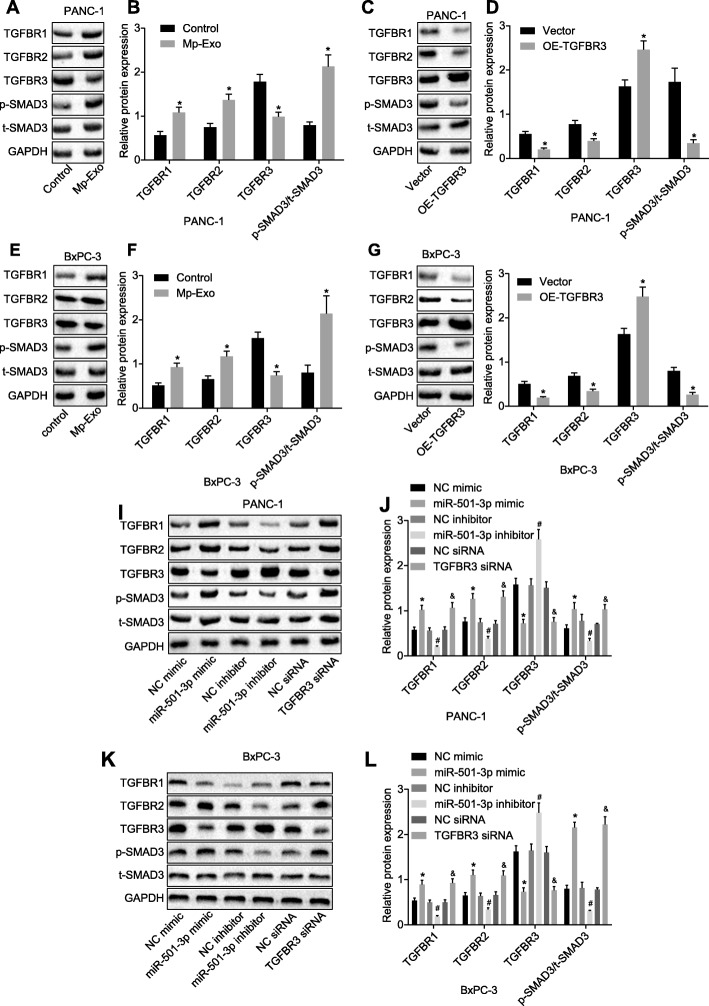
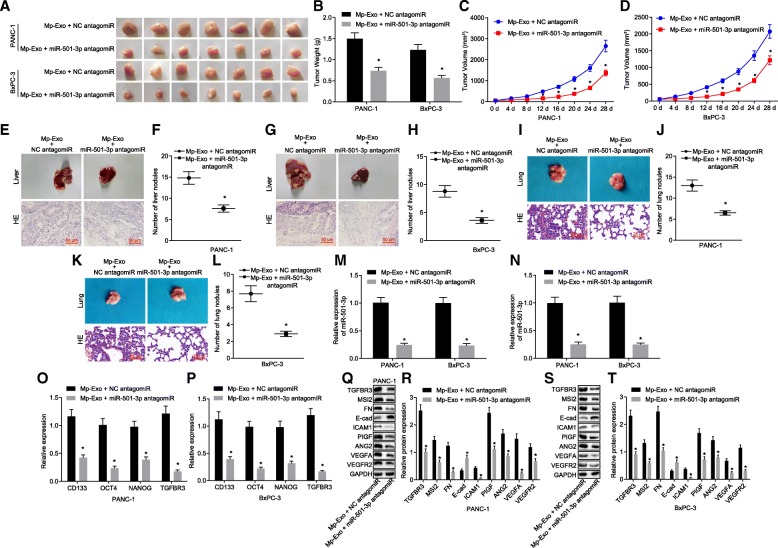
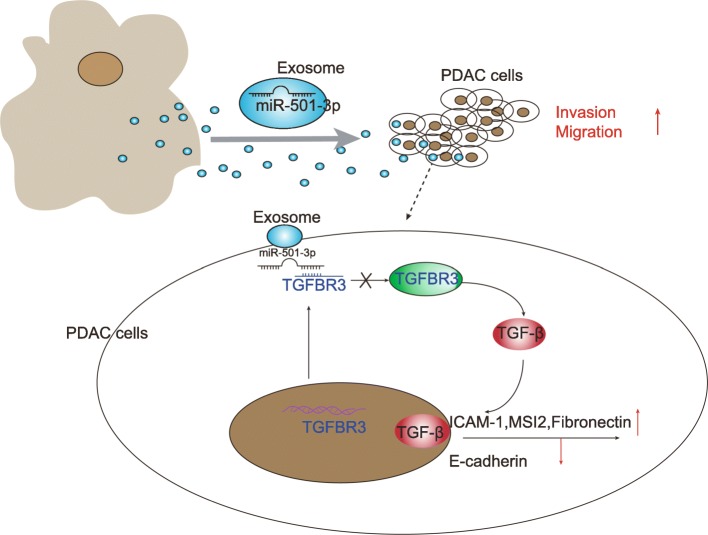
Results: TAM recruitment in PDAC tissues was associated with metastasis. Highly expressed miR-501-3p was observed in PDAC tissues and TAM-derived exosomes. Both M2 macrophage-derived exosomes and miR-501-3p promoted PDAC cell migration and invasion, as well as tumor formation and metastasis in nude mice. MiR-501-3p was verified to target TGFBR3. PDAC cells presented with down-regulated TGFBR3, which was further decreased in response to M2 macrophage treatment. TGF-β signaling pathway activation was implicated in the promotion of miR-501-3p in PDAC development. The suppression of macrophage-derived exosomal miR-501-3p resulted in the inhibition of tumor formation and metastasis in vivo.

Conclusion: M2 macrophage-derived exosomal miR-501-3p inhibits tumor suppressor TGFBR3 gene and facilitates the development of PDAC by activating the TGF-β signaling pathway, which provides novel targets for the molecular treatment of PDAC.

Keywords: Angiogenesis; Cell invasion; Exosome; M2 macrophage; Metastasis; MicroRNA-501-3p; Pancreatic ductal adenocarcinoma; TGF-β signaling pathway; TGFBR3.


Conflict of interest statement

The authors declare that they have no competing interests.

Figures

Fig. 1
Fig. 1
Tumor-associated macrophage recruitment in PDAC associates with cancer metastasis. a and b immunohistochemical staining and quantitative analysis of F4/80 positive expression in metastatic and non-metastatic PDAC tissues. c correlation of TAM recruitment with survival curve of PDAC patients. d relative expression of miR-501-3p in metastatic and non-metastatic PDAC patients. e HE staining for PDAC tissues. * p < 0.05. The measurement data were expressed as mean ± standard deviation. Data between two groups were analyzed by independent sample t test. Kaplan-Meier method and the log-rank test were employed to analyze the relationship between TAM recruitment in PDAC and overall survival
Fig. 2
Fig. 2
M2 macrophage-derived exosomes promote migration and invasion of PDAC cells. a the expression of marker genes for M1 and M2 macrophages determined by RT-qPCR. b the expression of miR-501-3p in PDAC cells determined by RT-qPCR. c identification of exosome structure under a transmission electron microscope (Scale bar = 100 nm). d detection of the size and number of exosomes (3 colors represent 3 replicates) by Nanoparticle tracking analysis. e Western blot analysis of TSG101, CD63 and CD81 protein after Mp-Exo treatment; evaluation of the expression of M2 macrophage exosomal markers when compared with that in the control group without any transfection. f miR-501-3p expression in response to Mp-Exo treatment determined by RT-qPCR. g fluorescence staining analysis of PKH-67 labeled Mp-Exo exosome internalization in PANC-1, BxPC-3 and HMEC-1 cells (Scale bar = 25 μM). h proliferation of PANC-1 and BxPC-3 cells after Mp-Exo treatment was examined using CCK-8 assay. i migration and invasive ability of PANC-1 and BxPC-3 cells after Mp-Exo treatment was examined by Transwell assay (Scale bar = 50 μM). j Western blot analysis of pro/cleaved caspase 3 and pro/cleaved PARP protein in PANC-1 and BxPC-3 cells after Mp-Exo treatment. k. In vitro tube formation assay was used to examine the HMEC-1 tube formation ability and quantitative analysis of branch points in PANC-1 and BxPC-3 cells (Scale bar = 100 μM). l. Western blot analysis was applied to detect migration, invasion and angiogenesis-related proteins in PANC-1 and BxPC-3 cells after Mp-Exo treatment. * p < 0.05 vs. M1 macrophage, THP-1 cells or control (cells without Mp-Exo treatment). The measurement data were expressed as mean ± standard deviation. Data between two groups were analyzed by independent sample t test. One-way ANOVA was employed for comparison among multiple groups, followed by Tukey’s post-hoc test. The data at different time points were compared using repeated measures ANOVA, followed by Tukey’s post-hoc test. Cell experiments were repeated three times
Fig. 3
Fig. 3
M2 macrophage-derived exosomes promote tumor formation and metastasis in nude mice. a a sketch map of tumor formation in nude mice. b-e xenograft tumors and quantitative analysis of tumor mass after Mp-Exo treatment (n = 7). f-m HE staining analysis and quantitative analysis of liver and lung nodules after Mp-Exo treatment (n = 7). n-o the expression of miR-501-3p in subcutaneous tumors of nude mice determined by RT-qPCR (n = 7). p and q cell cycle-related gene expression in subcutaneous tumors of nude mice was determined by RT-qPCR. r-u Western blot analysis was conducted to detect migration, invasion and angiogenesis-related proteins in response to Mp-Exo treatment. * p < 0.05 vs. control (cells without Mp-Exo treatment). The measurement data were expressed as mean ± standard deviation. Data between two groups were analyzed by t test. The data at different time points were compared using repeated measures ANOVA, followed by Tukey’s post-hoc test
Fig. 4
Fig. 4
MiR-501-3p from M2 macrophage-derived exosomes promotes migration and invasion of PDAC cells. a and b expression of miR-501-3p in PANC-1 and BxPC-3 cells treated with miR-501-3p mimic and Mp-Exo + miR-501-3p inhibitor was determined by RT-qPCR. c and d proliferation of PANC-1 and BxPC-3 cells treated with miR-501-3p mimic and Mp-Exo + miR-501-3p inhibitor was examined using CCK-8 assay. e-h Western blot analysis of cleaved caspase 3 and cleaved PARP proteins in PANC-1 and BxPC-3 cells treated with miR-501-3p mimic and Mp-Exo + miR-501-3p inhibitor. i-k migration and invasion of PANC-1 and BxPC-3 cells treated with miR-501-3p mimic and Mp-Exo + miR-501-3p inhibitor were examined by Transwell assay (Scale bar = 50 μM). l and m In vitro tube formation assay was applied to assess the HMEC-1 tube formation ability and quantitative analysis of branch points in PANC-1 and BxPC-3 cells treated with miR-501-3p mimic and Mp-Exo + miR-501-3p inhibitor (Scale bar = 100 μM). n-p Western blot analysis was applied to detect migration, invasion and angiogenesis-related proteins in response to miR-501-3p mimic and Mp-Exo + miR-501-3p inhibitor. * p < 0.05 vs. the NC mimic group. # p < 0.05 vs. the Mp-Exo + NC mimic group. The measurement data were expressed as mean ± standard deviation. One-way ANOVA was employed for comparison among multiple groups, followed by Tukey’s post-hoc test. The data at different time points were compared using repeated measures ANOVA, followed by Tukey’s post-hoc test. Cell experiments were repeated three times
Fig. 5
Fig. 5
In silico analysis for differentially expressed genes and regulatory miRNAs related to PDAC treated with macrophages. a-c heat maps of differentially expressed genes obtained from gene expression datasets with macrophage-treated PDAC samples and common PDAC datasets. The abscissa represents the sample number, and the ordinate represents the differential expressed gene; the histogram at the left refers to gene expression cluster, and the histogram at the upper right refers to color gradation. d the intersection of the gene expression datasets analysis. The three circles in the panel represent the down-regulated genes in the three gene expression datasets, and the middle part represents the intersection of the three sets of data. e the expression of TGFBR3 in each tumor data of TCGA database. The abscissa indicates the sample type and tumor type, and the ordinate indicates the gene expression. f prediction of regulatory miRNAs of TGFBR3. The two sets of data in the panel are retrieved from the TargetScan database prediction and the study revealing miRNAs expressed in macrophage exosomes, and the middle part represents the intersection of the two sets of data
Fig. 6
Fig. 6
MiR-501-3p promotes migration, invasion and tube formation of PDAC cells by down-regulating TGFBR3. a the predicted binding sites of miR-501-3p and TGFBR3 on TargetScan database. b the binding of miR-501-3p to TGFBR3 was confirmed by dual luciferase reporter gene assay. * p < 0.05 vs. mimic-NC. C. RT-qPCR detection of TGFBR3 mRNA levels in PANC-1 and BxPC-3 cells treated with miR-501-3p mimic. * p < 0.05 vs. NC mimic. d and e Western blot analysis of TGFBR3 protein in PANC-1 and BxPC-3 cells treated with miR-501-3p mimic. * p < 0.05 vs. NC mimic. f-i migration and invasion abilities of PANC-1 and BxPC-3 cells treated with miR-501-3p mimic vector, miR-501-3p mimic + oe-TGFBR3, Mp-Exo + vector, PBS + oe-TGFBR3 and Mp-Exo + oe-TGFBR3 were measured by Transwell assay (200 ×). * p < 0.05 vs. NC mimic + vector, PBS + vector. # p < 0.05 vs. NC mimic + oe-TGFBR3, PBS + oe-TGFBR3. j-m In vitro tube formation assay was used to detect HMEC-1 cell tube formation ability and quantitative analysis in response to miR-501-3p mimic vector, miR-501-3p mimic + oe-TGFBR3, Mp-Exo + vector, PBS + oe-TGFBR3 and Mp-Exo + oe-TGFBR3 (Scale bar = 100 μM). * p < 0.05 vs. NC mimic + vector, PBS + vector. # p < 0.05 vs. NC mimic + oe-TGFBR3, PBS + oe-TGFBR3. n-q Western blot analysis was used to detect migration, invasion and angiogenesis-related proteins in response to miR-501-3p mimic vector, miR-501-3p mimic + oe-TGFBR3, Mp-Exo + vector, PBS + oe-TGFBR3 and Mp-Exo + oe-TGFBR3. * p < 0.05 vs. NC mimic + vector, # p < 0.05 vs. NC mimic + oe-TGFBR3, PBS + oe-TGFBR3. R. RT-qPCR detection for mRNA expression of TGFBR3 in metastatic and non-metastatic PDAC tissues (n = 14–42). * p < 0.05 vs. non-metastatic tissue. S and T. Western blot analysis was used to detect TGFBR3 protein in metastatic and non-metastatic PDAC tissues (n = 14–42). * p < 0.05 vs. tissues without metastatic. The measurement data were expressed as mean ± standard deviation. The comparison between two groups was performed by independent sample t test. One-way ANOVA was employed for comparison among multiple groups, followed by Tukey’s post-hoc test. Cell experiments were repeated three times
Fig. 7
Fig. 7
TGF-β signaling pathway is involved in the effect of miR-501-3p on PDAC cells. a and b Western blot analysis was used to detect the TGF-β signaling pathway-related proteins in PANC-1 cells after Mp-Exo treatment. c and d Western blot analysis was applied to detect the TGF-β signaling pathway-related proteins in PANC-1 cells treated with oe-TGFBR3. e and f Western blot analysis was conducted to detect the TGF-β signaling pathway-related proteins in BxPC-3 cells after Mp-Exo treatment. g and h Western blot analysis was used to detect the TGF-β signaling pathway-related proteins in BxPC-3 cells treated with oe-TGFBR3. i and j Western blot analysis was applied to detect the TGF-β signaling pathway-related proteins in PANC-1 cells after treatment of miR-501-3p mimic, inhibitor or TGFBR3 siRNA. k and l Western blot analysis was used to detect the TGF-β signaling pathway-related proteins in BxPC-3 cells after treatment of miR-501-3p mimic, inhibitor or TGFBR3 siRNA. * p < 0.05 vs. control, vector or NC mimic. # p < 0.05 vs. NC inhibitor. & p < 0.05 vs. NC siRNA. The measurement data were expressed as mean ± standard deviation. Data between two groups were analyzed by independent sample t test. One-way ANOVA was employed for comparison among multiple groups, followed by Tukey’s post-hoc test. Cell experiments were repeated three times
Fig. 8
Fig. 8
Inhibition of miR-501-3p in macrophage exosomes represses tumor formation and metastasis in nude mice. a-d xenograft tumors and quantitative analysis of tumor mass after Mp-Exo + miR-501-3p antagomiR treatment (n = 7). M2 macrophages were transfected with NC antagomiR or miR-501-3p antagomiR, after which exosomes were extracted and injected into the nude mice. Tissue samples were collected after 4 weeks to detect relevant indicators. e-l HE staining analysis and quantitative analysis of liver and lung nodules after Mp-Exo + miR-501-3p antagomiR treatment (n = 7). m and n. RT-qPCR detection of the expression of miR-501-3p in subcutaneous tumor tissues and exosomes from the serum of nude mice in response to Mp-Exo + miR-501-3p antagomiR. o and p RT-qPCR detection of expression of tumor cell stemness-related genes and THFBR3 in mouse subcutaneous tumor tissues in response to Mp-Exo + miR-501-3p antagomiR. q-t Western blot analysis of migration, invasion and angiogenesis-related proteins as well as TGFBR3 protein in PANC-1 and BxPC-3 cells treated with Mp-Exo + miR-501-3p antagomiR. * p < 0.05 vs. Mp-Exo + NC antagomiR. The measurement data were expressed as mean ± standard deviation. Data between two groups were analyzed by independent sample t test. One-way ANOVA was employed for comparison among multiple groups. The data at different time points were compared using repeated measures ANOVA, followed by Tukey’s post-hoc test
Fig. 9
Fig. 9
Schematic representation of macrophage-derived exosomal miR-501-3p in PDAC and the involvement of TGFBR3-mediated TGF-β signaling pathway. M2 macrophages deliver miR-501-3p through exosomes in PDAC cells, thereby down-regulating TGFBR3 expression, and ultimately accelerate the development of PDAC via the TGF-β signaling pathway, corresponding to enhanced PDAC cell invasion and migration

Similar articles

Cited by

References

    1. Luchini C, Capelli P, Scarpa A. Pancreatic ductal adenocarcinoma and its variants. Surg Pathol Clin. 2016;9:547–560. doi: 10.1016/j.path.2016.05.003. - DOI - PubMed
    1. Chiaravalli M, Reni M, O'Reilly EM. Pancreatic ductal adenocarcinoma: state-of-the-art 2017 and new therapeutic strategies. Cancer Treat Rev. 2017;60:32–43. doi: 10.1016/j.ctrv.2017.08.007. - DOI - PubMed
    1. Pugalenthi A, Protic M, Gonen M, Kingham TP, Angelica MI, Dematteo RP, Fong Y, Jarnagin WR, Allen PJ. Postoperative complications and overall survival after pancreaticoduodenectomy for pancreatic ductal adenocarcinoma. J Surg Oncol. 2016;113:188–193. doi: 10.1002/jso.24125. - DOI - PMC - PubMed
    1. Paik KY, Choi SH, Heo JS, Choi DW. Analysis of liver metastasis after resection for pancreatic ductal adenocarcinoma. World J Gastrointest Oncol. 2012;4:109–114. doi: 10.4251/wjgo.v4.i5.109. - DOI - PMC - PubMed
    1. Downs-Canner S, Zenati M, Boone BA, Varley PR, Steve J, Hogg ME, Zureikat A, Zeh HJ, Lee KK. The indolent nature of pulmonary metastases from ductal adenocarcinoma of the pancreas. J Surg Oncol. 2015;112:80–85. doi: 10.1002/jso.23943. - DOI - PMC - PubMed

MeSH terms