. 2019 Sep 23;63(10):e00680-19.
doi: 10.1128/AAC.00680-19. Print 2019 Oct.

Role of the msaABCR Operon in Cell Wall Biosynthesis, Autolysis, Integrity, and Antibiotic Resistance in Staphylococcus aureus

Affiliations

Role of the msaABCR Operon in Cell Wall Biosynthesis, Autolysis, Integrity, and Antibiotic Resistance in Staphylococcus aureus

Bibek G C et al. Antimicrob Agents Chemother. .

Abstract

Staphylococcus aureus is an important human pathogen in both community and health care settings. One of the challenges with S. aureus as a pathogen is its acquisition of antibiotic resistance. Previously, we showed that deletion of the msaABCR operon reduces cell wall thickness, resulting in decreased resistance to vancomycin in vancomycin-intermediate S. aureus (VISA). In this study, we investigated the nature of the cell wall defect in the msaABCR operon mutant in the Mu50 (VISA) and USA300 LAC methicillin-resistant Staphylococcus aureus (MRSA) strains. Results showed that msaABCR mutant cells had decreased cross-linking in both strains. This defect is typically due to increased murein hydrolase activity and/or nonspecific processing of murein hydrolases mediated by increased protease activity in mutant cells. The defect was enhanced by a decrease in teichoic acid content in the msaABCR mutant. Therefore, we propose that deletion of the msaABCR operon results in decreased peptidoglycan cross-linking, leading to increased susceptibility toward cell wall-targeting antibiotics, such as β-lactams and vancomycin. Moreover, we also observed significantly downregulated transcription of early cell wall-synthesizing genes, supporting the finding that msaABCR mutant cells have decreased peptidoglycan synthesis. More specifically, the msaABCR mutant in the USA300 LAC strain (MRSA) showed significantly reduced expression of the murA gene, whereas the msaABCR mutant in the Mu50 strain (VISA) showed significantly reduced expression of glmU, murA, and murD Thus, we conclude that the msaABCR operon controls the balance between cell wall synthesis and cell wall hydrolysis, which is required for maintaining a robust cell wall and acquiring resistance to cell wall-targeting antibiotics, such as vancomycin and the β-lactams.

Keywords: Staphylococcus aureus; antibiotic resistance; cell wall; msaABCR; peptidoglycan.


Figures

FIG 1
FIG 1
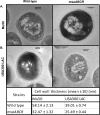
The msaABCR operon regulates cell wall morphology. Transmission electron micrographs of cells of the wild type and msaABCR operon deletion mutant in the Mu50 (A) and USA300 LAC (B) strains. (Bottom) Cell wall thicknesses of the wild type and msaABCR operon deletion mutant in the USA300 LAC and Mu50 strains.
FIG 2
FIG 2
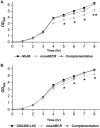
msaABCR mutant growth yield is lower than the wild type in the presence of lysozyme. Growth curves in the presence of lysozyme. The starter cultures for all test strains were normalized to an OD600 of 0.05 and incubated further until an OD600 reading of 1.0. The cultures were then treated with 500 μg/ml lysozyme, and the growth kinetics were measured by taking the OD600 reading every hour. Mu50 (A) and USA300 LAC (B) strain backgrounds and their respective msaABCR mutant and complementation strains. These results represent the means from three independent experiments. Error bars represent the standard errors (SEs). Student’s t test and one-way analysis of variance (ANOVA) were used to compare the results from the wild types with those from their corresponding mutants. *, P < 0.05; **, P < 0.005.
FIG 3
FIG 3
msaABCR mutant S. aureus is lysed with lysozyme at a higher rate than for the wild type. Population profiles at different time points when 500 μg/ml lysozyme was added to cultures of the Mu50 (A) and USA300 LAC (B) strain backgrounds and their respective msaABCR mutant and complementation strains after 2 h of growth of the starter culture. These results represent the means from three independent experiments performed in triplicates. Error bars represent the SEs. Student’s t test and one-way ANOVA were used to compare the results from the wild types with those from their corresponding mutants. *, P < 0.05; **, P < 0.005.
FIG 4
FIG 4
msaABCR mutant cells are lysed at a higher rate than for the wild type in the presence of lysozyme. Lysozyme-induced whole-cell lysis. S. aureus cells were suspended in PBS and digested with 350 μg/ml lysozyme. Cell lysis was measured as a decrease in OD600 in Mu50 (A) and USA300 LAC (B) strain backgrounds and in their respective msaABCR mutant and complementation strains. These results represent the means from three independent experiments. Error bars represent the SEs. Student’s t test and one-way ANOVA were used to compare the results from the wild types with those from their corresponding mutants. *, P < 0.05; **, P < 0.005.
FIG 5
FIG 5
The msaABCR mutant of the Mu50 strain is lysed with lysostaphin at a higher rate than for the wild type. Lysostaphin lysis assay. S. aureus wild-type, msaABCR mutant, and complementation strains in the Mu50 (A) and USA300 LAC (B) strain backgrounds were grown to an OD of 1 at 37°C in TSB medium. Bacteria were harvested by centrifugation, washed twice with Tris buffer, and suspended to an initial OD600 of ∼1. Lysostaphin lysis assays were performed with 0.5 μg/ml lysostaphin, and lysis was measured as a decline in OD600 over time. These results represent the means from three independent experiments. Error bars represent the SEs. Student’s t test and one-way ANOVA were used to compare the results from the wild types with those from their corresponding mutants. *, P < 0.05
FIG 6
FIG 6
msaABCR mutant peptidoglycans are lysed in the presence of lysozyme at a higher rate than for the wild type. Digestion of peptidoglycan devoid of teichoic acid and acetyl groups with lysozyme. Peptidoglycan was suspended in 80 mM sodium phosphate-buffered saline (0.5 mg/ml) and digested with 350 μg/ml lysozyme. Lysis of peptidoglycan was measured as a decrease in OD600 in the Mu50 (A) and USA300 LAC (B) strain backgrounds and their respective msaABCR mutant and complementation strains. These results represent the means from three independent experiments. Error bars represent the SEs. Student’s t test and one-way ANOVA were used to compare the results from the wild types with those from their respective mutants. *, P < 0.05.
FIG 7
FIG 7
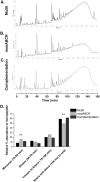
msaABCR mutant peptidoglycan is less cross-linked than the wild type. (A to C) HPLC chromatograms of mutanolysin-digested peptidoglycan purified from the indicated strains in the Mu50 strain background. The peaks were identified according to de Jonge et al. (67). Representative results of three individual experiments are shown. (D) Muropeptide composition expressed as the percentage of the total area under the curve for each strain. The figure shows percentages indicating the relative abundances of monomers, dimers, trimers to 8-mers, and higher oligomers in each strain. These results represent the means from three independent experiments. Error bars represent the SEs. Student’s t test and one-way ANOVA were used to compare the results from the wild type with those from mutants. **, P < 0.005.
FIG 8
FIG 8
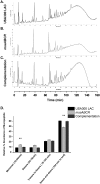
msaABCR mutant peptidoglycan is less cross-linked than the wild type. (A to C) HPLC chromatograms of mutanolysin-digested peptidoglycan purified from the indicated strains in the USA300 LAC strain background. The peaks were identified according to de Jonge et al. (67). Representative results of three individual experiments are shown. (D) Muropeptide composition expressed as the percentage of the total area under the curve for each strain. The figure shows percentages indicating the relative abundances of monomers, dimers, trimers to 8-mers, and higher oligomers in each strain. These results represent the means from three independent experiments. Error bars represent the SEs. Student’s t test and one-way ANOVA were used to compare the results from the wild type with those from the deletion mutant. **, P < 0.005.
FIG 9
FIG 9
Decreased cross-linking in msaABCR mutant peptidoglycan is independent of PBPs. Fluorescence penicillin-binding assay with purified cell membranes from the wild type, its msaABCR mutant, and its complementation mutant in the USA300 LAC and Mu50 strain backgrounds. Gradient gel visualized with Alexa Fluor 488. Representative results of three individual experiments are shown.
FIG 10
FIG 10
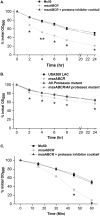
Increased lysis in the msaABCR mutant is reversed to wild-type levels when all proteases are deleted or inhibited in the mutant. Lysozyme-induced whole-cell lysis. S. aureus cells were suspended in PBS and digested with 350 μg/ml lysozyme. Lysis of Mu50 wild type (WT), its msaABCR mutant, and its msaABCR mutant grown in the presence of a protease inhibitor cocktail (A) and USA300 LAC WT, its msaABCR-deletion mutant, its all-protease deletion mutant, and its msaABCR deletion/all-protease deletion double mutant (B) was measured as a decrease in OD600. (C) Lysostaphin lysis assay. Mu50 WT, its msaABCR mutant, and its msaABCR mutant grown in the presence of a protease inhibitor cocktail were grown to an OD of 1 at 37°C in TSB medium. Bacteria were harvested by centrifugation, washed twice with Tris buffer, and suspended to obtain an initial OD600 of ∼1. Lysostaphin lysis assays were performed with 0.5 μg/ml (A), and lysis was measured as a decline in OD600 over time. These results represent the means from three independent experiments. Error bars represent the SEs. Student’s t test and one-way ANOVA were used to compare the results from the wild types with those from their mutants. *, P < 0.05; **, P < 0.005.
FIG 11
FIG 11
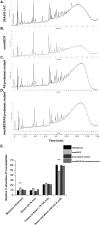
Cross-linking defect in the msaABCR deletion mutant is due to increased protease activity. (A to D) HPLC chromatograms of mutanolysin-digested peptidoglycan purified from the indicated strains in the LAC strain background. The peaks were identified according to de Jonge et al. (67). Representative results of three individual experiments are shown. (E) Muropeptide composition expressed as the percentage of the total area under the curve for each strain. The figure shows percentages indicating the relative abundances of monomers, dimers, trimers to 8-mers, and higher oligomers in each strain. These results represent the means from three independent experiments. Error bars represent the SEs. Student’s t test and one-way ANOVA were used to compare the results from the wild type with those from its mutant. **, P < 0.005.
FIG 12
FIG 12
Cross-linking defect in the msaABCR mutant may be mediated by increased processing of the major autolysin, AtlA, and increased activity. SDS-extracted cell wall-bound murein hydrolase zymogram. (A) Cell wall-bound murein hydrolase zymogram of Mu50 WT, its msaABCR deletion mutant, and its msaABCR complement. (B) Cell wall-bound murein hydrolase zymogram of USA300 LAC WT, its msaABCR deletion mutant, its msaABCR complement, its all-protease mutant, and its msaABCR deletion/all-protease deletion double mutant. Representative results of three individual experiments are shown.
FIG 13
FIG 13
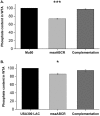
Decreased teichoic acid in msaABCR mutant cells increases their susceptibility to cleavage by murein hydrolases. (A) Comparison of the percentages of phosphate contents in wall teichoic acid (WTA) in the wild type, its msaABCR mutant, and its msaABCR complement in the Mu50 strain background. (B) Comparison of the percentages of phosphate contents in wall teichoic acid (WTA) in the wild type, its msaABCR mutant, and its msaABCR complement in the USA300 LAC strain background. These results represent the means from three independent experiments performed in triplicates. Error bars represent the standard errors. Student’s t test (OriginPro) and one-way ANOVA were used to compare the results from the wild type with those from its mutant. *, P < 0.05; ***, P < 0.0005.

Similar articles

Cited by

References

    1. Chatterjee SS, Otto M. 2013. Improved understanding of factors driving methicillin-resistant Staphylococcus aureus epidemic waves. Clin Epidemiol 5:205–217. doi:10.2147/CLEP.S37071. - DOI - PMC - PubMed
    1. Dayan GH, Mohamed N, Scully IL, Cooper D, Begier E, Eiden J, Jansen KU, Gurtman A, Anderson AS. 2016. Staphylococcus aureus: the current state of disease, pathophysiology and strategies for prevention. Expert Rev Vaccines 15:1373–1392. doi:10.1080/14760584.2016.1179583. - DOI - PubMed
    1. Assis LM, Nedeljkovic M, Dessen A. 2017. New strategies for targeting and treatment of multi-drug resistant Staphylococcus aureus. Drug Resist Updat 31:1–14. doi:10.1016/j.drup.2017.03.001. - DOI - PubMed
    1. Roemer T, Schneider T, Pinho MG. 2013. Auxiliary factors: a chink in the armor of MRSA resistance to beta-lactam antibiotics. Curr Opin Microbiol 16:538–548. doi:10.1016/j.mib.2013.06.012. - DOI - PubMed
    1. Berger-Bächi B, Rohrer S. 2002. Factors influencing methicillin resistance in staphylococci. Arch Microbiol 178:165–171. doi:10.1007/s00203-002-0436-0. - DOI - PubMed

Publication types

MeSH terms

LinkOut - more resources