. 2019 Sep;30(9):1625-1640.
doi: 10.1681/ASN.2019020152. Epub 2019 Jul 15.

Contributions of Rare Gene Variants to Familial and Sporadic FSGS

Affiliations

Contributions of Rare Gene Variants to Familial and Sporadic FSGS

Minxian Wang et al. J Am Soc Nephrol. 2019 Sep.

Abstract

Background: Over the past two decades, the importance of genetic factors in the development of FSGS has become increasingly clear. However, despite many known monogenic causes of FSGS, single gene defects explain only 30% of cases.

Methods: To investigate mutations underlying FSGS, we sequenced 662 whole exomes from individuals with sporadic or familial FSGS. After quality control, we analyzed the exome data from 363 unrelated family units with sporadic or familial FSGS and compared this to data from 363 ancestry-matched controls. We used rare variant burden tests to evaluate known disease-associated genes and potential new genes.

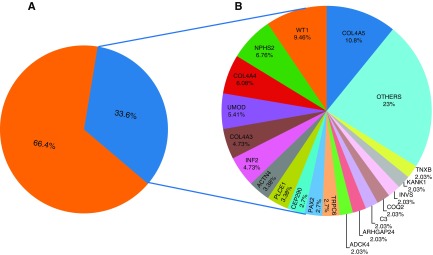
Results: We validated several FSGS-associated genes that show a marked enrichment of deleterious rare variants among the cases. However, for some genes previously reported as FSGS related, we identified rare variants at similar or higher frequencies in controls. After excluding such genes, 122 of 363 cases (33.6%) had rare variants in known disease-associated genes, but 30 of 363 controls (8.3%) also harbored rare variants that would be classified as "causal" if detected in cases; applying American College of Medical Genetics filtering guidelines (to reduce the rate of false-positive claims that a variant is disease related) yielded rates of 24.2% in cases and 5.5% in controls. Highly ranked new genes include SCAF1, SETD2, and LY9. Network analysis showed that top-ranked new genes were located closer than a random set of genes to known FSGS genes.

Conclusions: Although our analysis validated many known FSGS-causing genes, we detected a nontrivial number of purported "disease-causing" variants in controls, implying that filtering is inadequate to allow clinical diagnosis and decision making. Genetic diagnosis in patients with FSGS is complicated by the nontrivial rate of variants in known FSGS genes among people without kidney disease.

Keywords: focal segmental glomerulosclerosis; human genetics; kidney.


Figures

None
Graphical abstract
Figure 1.
Figure 1.
Data analysis diagram. After quality control, 363 unrelated case families with ancestry-matched controls were included in this study. Rare variants in known disease-causing genes were profiled (genetic diagnosis); common variants association test and gene burden test for moderately rare and extremely rare variants were conducted thereafter.
Figure 2.
Figure 2.
Quality control for study samples. (A and B) PCA plot for case and control samples mixed with 1000 Genomes Project samples. EUR, European; EAS, East Asian; AMR, admixed American; SAS, South Asian; AA, African American; AFR, African. (C and D) PCA plot for case and control matched samples. (E) QQ plot for the genome-wide association study before case/control matching. (F) QQ plot for the genome-wide association study after case/control matching, where ƛ is the genomic inflation factor.
Figure 3.
Figure 3.
Rare variants discovered in known genes. Variants were filtered by allele frequency, CADD score, and genotype-phenotype cosegregation. (A) Variants were filtered by dominant model/X-linked model. (B) Variants were filtered by recessive compound heterozygous model. (C) Variants were filtered by single site homozygous recessive model. (D–F) Variants filtered by the same conditions as A, B, and C, respectively, with further variant filtering following ACMG guidelines, where only variants with multiple lines of computational evidence supporting pathogenicity were included. *Variants outside of the known disease-causing domain were not included.
Figure 4.
Figure 4.
Pie chart of rare variants in known kidney disease–associated genes. Genes with a similar or higher level of burden in control samples were not included here. (A) The proportion of families with rare variants in known genes (blue section) versus without (orange section). (B) A pie chart showing variants in FSGS cases with disease explained by rare variants in known genes.
Figure 5.
Figure 5.
Burden test for extremely rare variants of the dominant model. Volcano plot for “single-group” analysis (comparison of observed rare variant rate with expected rate of each gene) and “case-control” analysis. The x axis shows the difference in the number of families with qualified rare variants between case and control samples. The y axis height of each dot shows the −log10(P value) of the “single-group” analysis, where on the left (x<0), P value is on the basis of the analysis of control samples, whereas in the right part of this figure (x>0), each dot shows the P value of a gene from the analysis of case samples.
Figure 6.
Figure 6.
Closer network distance of top ranked genes with known kidney disease–associated genes than a random set of genes. We computed the network distance between the 50 top-ranked genes (with known kidney disease–associated genes excluded) identified from the rare variant burden test under a dominant model and known disease-associated genes. “fsgs” refers to genes known to cause FSGS when mutated; “expanded” means an expanded set of genes that are associated with various kidney disease phenotypes. “expanded.fsgs” indicates the normalized network distance between the “fsgs” panel and the “expanded” gene panel (excluding overlaps with “fsgs” panel) as a positive control. “fsgs.CASE” indicates the network distance of the 50 top-ranked genes from case samples on the basis of rare missense variants and LOF variants compared with the FSGS panel. “expanded.CASE” indicates the distance from the top 50 genes to the “expanded” panel. “fsgs.CTRL” and “expanded.CTRL” are control analyses that indicate the network distance between the 50 top-ranked genes from the control samples chosen by the burden of rare missense variants and LOF variants and the “fsgs” or “expanded” panels. “fsgs.CASE.syn” and “expanded.CASE.syn” indicate the network distance between the 50 top-ranked genes from case samples by synonymous rare variants and the “‘fsgs” or “expanded” panels. The background distribution was estimated by bootstrapping 1000 times, and randomly picking 50 genes from the pool of all genes to replace the 50 top-ranked genes. (A) Network distance measured on the basis of the structure from the STRING network. (B) Network distance measured on the basis of the structure from the inBio Map network.

References

    1. Rosenberg AZ, Kopp JB: Focal segmental glomerulosclerosis. Clin J Am Soc Nephrol 12: 502–517, 2017 - PMC - PubMed
    1. Lovric S, Ashraf S, Tan W, Hildebrandt F: Genetic testing in steroid-resistant nephrotic syndrome: When and how? Nephrol Dial Transplant 31: 1802–1813, 2016 - PMC - PubMed
    1. Kaplan JM, Kim SH, North KN, Rennke H, Correia LA, Tong HQ, et al. .: Mutations in ACTN4, encoding α-actinin-4, cause familial focal segmental glomerulosclerosis. Nat Genet 24: 251–256, 2000 - PubMed
    1. Winn MP, Conlon PJ, Lynn KL, Farrington MK, Creazzo T, Hawkins AF, et al. .: A mutation in the TRPC6 cation channel causes familial focal segmental glomerulosclerosis. Science 308: 1801–1804, 2005 - PubMed
    1. Brown EJ, Schlöndorff JS, Becker DJ, Tsukaguchi H, Tonna SJ, Uscinski AL, et al. .: Mutations in the formin gene INF2 cause focal segmental glomerulosclerosis. Nat Genet 42: 72–76, 2010 - PMC - PubMed

Publication types

LinkOut - more resources