HILPDA Regulates Lipid Metabolism, Lipid Droplet Abundance, and Response to Microenvironmental Stress in Solid Tumors
- PMID: 31308147
- PMCID: PMC6774878
- DOI: 10.1158/1541-7786.MCR-18-1343
HILPDA Regulates Lipid Metabolism, Lipid Droplet Abundance, and Response to Microenvironmental Stress in Solid Tumors
Abstract
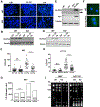
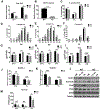
Accumulation of lipid droplets has been observed in an increasing range of tumors. However, the molecular determinants of this phenotype and the impact of the tumor microenvironment on lipid droplet dynamics are not well defined. The hypoxia-inducible and lipid droplet associated protein HILPDA is known to regulate lipid storage and physiologic responses to feeding conditions in mice, and was recently shown to promote hypoxic lipid droplet formation through inhibition of the rate-limiting lipase adipose triglyceride lipase (ATGL). Here, we identify fatty acid loading and nutrient deprivation-induced autophagy as stimuli of HILPDA-dependent lipid droplet growth. Using mouse embryonic fibroblasts and human tumor cells, we found that genetic ablation of HILPDA compromised hypoxia-fatty acid- and starvation-induced lipid droplet formation and triglyceride storage. Nutrient deprivation upregulated HILPDA protein posttranscriptionally by a mechanism requiring autophagic flux and lipid droplet turnover, independent of HIF1 transactivation. Mechanistically, loss of HILPDA led to elevated lipolysis, which could be corrected by inhibition of ATGL. Lipidomic analysis revealed not only quantitative but also qualitative differences in the glycerolipid and phospholipid profile of HILPDA wild-type and knockout cells, indicating additional HILPDA functions affecting lipid metabolism. Deletion studies of HILPDA mutants identified the N-terminal hydrophobic domain as sufficient for targeting to lipid droplets and restoration of triglyceride storage. In vivo, HILPDA-ablated cells showed decreased intratumoral triglyceride levels and impaired xenograft tumor growth associated with elevated levels of apoptosis. IMPLICATIONS: Tumor microenvironmental stresses induce changes in lipid droplet dynamics via HILPDA. Regulation of triglyceride hydrolysis is crucial for cell homeostasis and tumor growth.
©2019 American Association for Cancer Research.
Conflict of interest statement
CONFLICT OF INTEREST STATEMENT
The authors declare that they have no conflicts of interest with the contents of this article.
Figures


Similar articles
-
Regulation of lipid droplet homeostasis by hypoxia inducible lipid droplet associated HILPDA.Biochim Biophys Acta Mol Cell Biol Lipids. 2020 Sep;1865(9):158738. doi: 10.1016/j.bbalip.2020.158738. Epub 2020 May 11. Biochim Biophys Acta Mol Cell Biol Lipids. 2020. PMID: 32417386 Review.
-
Hypoxia-inducible lipid droplet-associated induces DGAT1 and promotes lipid storage in hepatocytes.Mol Metab. 2021 May;47:101168. doi: 10.1016/j.molmet.2021.101168. Epub 2021 Jan 16. Mol Metab. 2021. PMID: 33465519 Free PMC article.
-
Lipid droplet storage promotes murine pancreatic tumor growth.Oncol Rep. 2021 Apr;45(4):21. doi: 10.3892/or.2021.7972. Epub 2021 Mar 2. Oncol Rep. 2021. PMID: 33649859 Free PMC article.
-
HILPDA Uncouples Lipid Droplet Accumulation in Adipose Tissue Macrophages from Inflammation and Metabolic Dysregulation.Cell Rep. 2020 Feb 11;30(6):1811-1822.e6. doi: 10.1016/j.celrep.2020.01.046. Cell Rep. 2020. PMID: 32049012
-
Hypoxia, hypoxia-inducible gene 2 (HIG2)/HILPDA, and intracellular lipolysis in cancer.Cancer Lett. 2020 Nov 28;493:71-79. doi: 10.1016/j.canlet.2020.06.013. Epub 2020 Aug 18. Cancer Lett. 2020. PMID: 32818550 Free PMC article. Review.
Cited by
-
A practical spatial analysis method for elucidating the biological mechanisms of cancers with abdominal dissemination in vivo.Sci Rep. 2022 Nov 24;12(1):20303. doi: 10.1038/s41598-022-24827-w. Sci Rep. 2022. PMID: 36434071 Free PMC article.
-
A ferroptosis-related gene signature associated with immune landscape and therapeutic response in osteosarcoma.Front Oncol. 2022 Nov 11;12:1024915. doi: 10.3389/fonc.2022.1024915. eCollection 2022. Front Oncol. 2022. PMID: 36439512 Free PMC article.
-
Starvation induced autophagy promotes the progression of bladder cancer by LDHA mediated metabolic reprogramming.Cancer Cell Int. 2021 Nov 7;21(1):597. doi: 10.1186/s12935-021-02303-1. Cancer Cell Int. 2021. PMID: 34743698 Free PMC article.
-
Metabolic Escape Routes of Cancer Stem Cells and Therapeutic Opportunities.Cancers (Basel). 2020 May 31;12(6):1436. doi: 10.3390/cancers12061436. Cancers (Basel). 2020. PMID: 32486505 Free PMC article. Review.
-
Single-Cell RNA-Seq Analysis of Cells from Degenerating and Non-Degenerating Intervertebral Discs from the Same Individual Reveals New Biomarkers for Intervertebral Disc Degeneration.Int J Mol Sci. 2022 Apr 3;23(7):3993. doi: 10.3390/ijms23073993. Int J Mol Sci. 2022. PMID: 35409356 Free PMC article.
References
-
- Liu Q, Luo Q, Halim A, and Song G (2017) Targeting lipid metabolism of cancer cells: A promising therapeutic strategy for cancer. Cancer Lett 401, 39–45 - PubMed
-
- Corbet C, and Feron O (2015) Metabolic and mind shifts: from glucose to glutamine and acetate addictions in cancer. Curr Opin Clin Nutr Metab Care 18, 346–353 - PubMed
-
- Bensaad K, Favaro E, Lewis CA, Peck B, Lord S, Collins JM, Pinnick KE, Wigfield S, Buffa FM, Li JL, Zhang Q, Wakelam MJ, Karpe F, Schulze A, and Harris AL (2014) Fatty acid uptake and lipid storage induced by HIF-1alpha contribute to cell growth and survival after hypoxia-reoxygenation. Cell Rep 9, 349–365 - PubMed
Publication types
MeSH terms
Substances
Grants and funding
LinkOut - more resources
Full Text Sources

