. 2019 Aug 30;294(35):13093-13105.
doi: 10.1074/jbc.RA119.008342. Epub 2019 Jul 15.

A junctophilin-caveolin interaction enables efficient coupling between ryanodine receptors and BKCa channels in the Ca2+ microdomain of vascular smooth muscle

Affiliations

A junctophilin-caveolin interaction enables efficient coupling between ryanodine receptors and BKCa channels in the Ca2+ microdomain of vascular smooth muscle

Takanori Saeki et al. J Biol Chem. .

Abstract

Functional coupling between large-conductance Ca2+-activated K+ (BKCa) channels in the plasma membrane (PM) and ryanodine receptors (RyRs) in the sarcoplasmic reticulum (SR) is an essential mechanism for regulating mechanical force in most smooth muscle (SM) tissues. Spontaneous Ca2+ release through RyRs (Ca2+ sparks) and subsequent BKCa channel activation occur within the PM-SR junctional sites. We report here that a molecular interaction of caveolin-1 (Cav1), a caveola-forming protein, with junctophilin-2 (JP2), a bridging protein between PM and SR, positions BKCa channels near RyRs in SM cells (SMCs) and thereby contributes to the formation of a molecular complex essential for Ca2+ microdomain function. Approximately half of all Ca2+ sparks occurred within a close distance (<400 nm) from fluorescently labeled JP2 or Cav1 particles, when they were moderately expressed in primary SMCs from mouse mesenteric artery. The removal of caveolae by genetic Cav1 ablation or methyl-β-cyclodextrin treatments significantly reduced coupling efficiency between Ca2+ sparks and BKCa channel activity in SMCs, an effect also observed after JP2 knockdown in SMCs. A 20-amino acid-long region in JP2 appeared to be essential for the observed JP2-Cav1 interaction, and we also observed an interaction between JP2 and the BKCa channel. It can be concluded that the JP2-Cav1 interaction provides a structural and functional basis for the Ca2+ microdomain at PM-SR junctions and mediates cross-talk between RyRs and BKCa channels, converts local Ca2+ sparks into membrane hyperpolarization, and contributes to stabilizing resting tone in SMCs.

Keywords: blood pressure; calcium channel; calcium imaging; caveolin; fluorescence resonance energy transfer (FRET); molecular imaging; patch clamp; potassium channel; single-molecule biophysics; vascular smooth muscle cells.


Conflict of interest statement

The authors declare that they have no conflicts of interest with the contents of this article

Figures

Figure 1.
Figure 1.
Abundant expression of JP2 in MASMCs, and its interaction with Cav1. A, a Western blot analysis using a protein lysate isolated from the mouse mesenteric artery. B, an immunofluorescent image of a freshly isolated mMASMC obtained using a confocal microscope and its transmitted light image. C, co-IP indicating molecular coupling between JP2 and Cav1. Extracts of the rat mesenteric artery were processed for IP with anti-Cav1 antibodies. Bound proteins were solubilized and analyzed on SDS-PAGE, followed by immunoblotting for JP2. D, epifluorescent images obtained by PLA experiments for the interaction between JP2 and Cav1 in MASMCs from WT (top) and Cav1−/− mice (bottom). E, the number of puncta per cell was summarized (WT: n = 14, Cav1−/−: n = 10). F and G, JP2 and Cav1 in freshly isolated mMASMCs were labeled with specific antibodies, and then visualized using a TIRF microscope. Caveolae were disrupted by the treatment with 10 mm MβCD (G). Fluorescent signals corresponding to JP2, Cav1, and their co-localization are colored in green, red, and yellow (denoted by arrowheads), respectively. H and I, ratios of the number of co-localizing particles to those of all JP2 (H) or Cav1 (I) particles in control and MβCD-treated myocytes. **, p < 0.01; the Student's t test. Scale bars indicate 10 μm (B, D, F, and G).
Figure 2.
Figure 2.
Essential binding sites of JP2 for the interaction with Cav1. A, the JP2 truncation constructs ([1] to [5]) used in the present study are shown. MORN motifs, the joining regions, and ER transmembrane domains (ERTM) are indicated. B and C, a series of representative confocal images of the BiFC assay. Fluorescent signals in the top panels indicate the complementation of VN and VC. Corresponding transmitted light images are shown in the bottom. Representative images from three independent experiments are shown. D, the fluorescence intensity of complimented Venus within regions of interest (ROI) in each image was divided by that of the Hoechst signal. The Venus/Hoechst ratio of the mutants ([4-ii], [4-iii], and [5]) was normalized to that of JP2(276–674aa)-VN ([4-i]). Seven sets of images ([4-i], [4-ii], [4-iii], and [5]) were acquired from three independent experiments in epifluorescent fields. *, p < 0.05; **, p < 0.01; one-way ANOVA followed by Tukey's test. Scale bars indicate 10 μm (B and C).
Figure 3.
Figure 3.
TIRF imaging of the co-localization of RyR-JP2 and Cav1-RyR in mMASMCs. A and B, RyR and JP2 in freshly isolated mMASMCs were identified by immunostaining using antibodies specific to each protein and a TIRF microscope. Cells were nontreated or treated with MβCD before staining. TIRF images obtained from the area surrounded by the white line in transmitted light images (left) are shown. Fluorescent signals corresponding to RyR, JP2, and their co-localization are colored in red, green, and yellow (denoted by arrowheads), respectively. C and D, the ratio of the number of co-localizing particles to that of all JP2 (C) or RyR (D) particles in control (n = 8) and MβCD-treated myocytes (n = 9); p > 0.05; t test. E and F, RyR and Cav1 in freshly isolated mMASMCs were labeled with each specific antibody and visualized using a TIRF microscope. Fluorescent signals corresponding to RyR, Cav1, and their co-localization are shown in green, red, and yellow (denoted by arrowheads), respectively. G and H, the ratio of the number of co-localizing particles to that of all Cav1 (G) or RyR (H) particles in control and MβCD myocytes. *, p < 0.05; **, p < 0.01; t test. Scale bars indicate 10 μm (A, B, E, and F).
Figure 4.
Figure 4.
TIRF images of Ca2+ sparks and those of JP2 or Cav1 in mMASMCs. A and D, Ca2+ sparks in 40 mm [K+]o were detected with fluo-4/AM using a TIRF microscope. Continuous TIRF images of Ca2+ sparks were obtained at 27.2-ms intervals. Ca2+-spark images were merged with those of mCherry-JP2 or mCherry-cav1 (purple), which were separately recorded in the same cells. B and E, the distance from the center of a Ca2+-spark site to the center of the nearest mCherry-JP2 or mCherry-cav1 particles were measured. The number of observed sparks versus the distance is demonstrated in the distribution histogram (108 sparks from 12 mCherry-JP2-expressing cells, cav1; 146 sparks from 15 mCherry-cav1-expressing cells). C and F, the radii of mCherry-JP2 or mCherry-cav1 particles located closest to Ca2+-spark sites were measured (30 mCherry-JP2 particles, 59 mCherry-cav1 particles). The distribution histogram of radii is demonstrated and fit by the Lorenz function (red curves). Scale bars indicate 500 nm (A and D).
Figure 5.
Figure 5.
The JP2 protein and BKCa channels co-assembled in caveolae in mMASMCs. A and B, JP2 and BKα subunits in freshly isolated mMASMCs from WT (A) or Cav1−/− (B) mice were labeled with specific antibodies, and then visualized using a TIRF microscope. Fluorescent signals corresponding to BKCa, JP2, and their co-localization are colored in red, green, and yellow (denoted by arrowheads), respectively. C and D, ratios of the number of co-localizing particles to those of all JP2 (C) or BKα (D) particles in WT and Cav1−/− myocytes. E–H, the averaged fluorescence intensity in particles of BKα (E), the percentage of the integrated area occupied by BKα particles versus the cell area in TIRF images (F), the number of BKα particles per unit area (100 μm2) in TIRF images (G), and the integrated intensity of BKα particles per unit area (H) are shown. The number of cells examined was 8 for WT and 11 for Cav1−/− (C–H). **, p < 0.01; the Student's t test. I, a FRET analysis was performed in mMASMCs co-expressing YFP-JP2 and BKα-CFP from WT and Cav1−/−. Panels show YFP-JP2 and BKα-CFP emissions before (Pre) and after (Post) selective YFP photobleaching. The numerical value in each image indicates fluorescence intensity relative to that before bleaching. J, summarized data of EFRET in WT and Cav1−/− (YFP-JP2 + BKα-CFP in WT myocytes: 37 particles, 5 cells; YFP + BKα-CFP in WT myocytes: 51 particles, 11 cells, YFP-JP2 + BKα-CFP in Cav1−/− myocytes: 64 particles, 7 cells; YFP + BKα-CFP: 25 particles, 5 cells in Cav1−/− myocytes). *, p < 0.05; **, p < 0.01; two-way ANOVA was applied to the analysis (see Table S3). The effect of Cav1 on the FRET values (Effect 1) were compared in WT and Cav−/− was measured as the molecular interaction between YFP-JP2 and BKα-CFP. The effect of YFP on the molecular interaction between BKα-CFP and YFP-JP2 (Effect 2) was also compared in WT and Cav1−/−. The interaction between Effect 1 and Effect 2 was statistically significant (F-test, p < 0.05). Thus, the statistical significance between the four groups was examined by Tukey's test. Scale bars indicate 10 μm (A and B) and 2 μm (I), respectively. n.s., not significant.
Figure 6.
Figure 6.
JP2 mediates the molecular coupling of RyR and Cav1 in MASMCs. A, Western blotting analyses were performed using the protein lysate (30 μg) from mouse mesenteric artery tissues treated with siRNA for 4 days. The band density of JP2 was normalized to that of α-SM actin (JP2/α-SM actin). The ratio of siJP2 was normalized to that of siControl. B, summarized effects of siControl and siJP2 on JP2 protein expression in the mesenteric artery. C, representative transmitted light and immunofluorescent images of mMASMCs treated with siControl or siJP2. Myocytes were labeled with an anti-JP2 antibody and observed using a confocal microscope. D, summarized effects of siControl (n = 23) and siJP2 (n = 14) on JP2 expression estimated by fluorescent intensity. E and F, RyR and Cav1 in mMASMCs treated with siControl (E) or siJP2 (F) were labeled with the specific antibody and observed under a TIRF microscope. Fluorescent signals corresponding to Cav1, RyR, and their co-localization are colored in red, green, and yellow (denoted by arrowheads in merged), respectively. The yellow puncta in co-localized indicate only the overlapping signals of Cav1 and RyR. G and H, the co-localization ratio of RyR (G) or Cav1 (H) particles in myocytes treated with siControl (n = 9) or siJP2 (n = 8). *, p < 0.05; **, p < 0.01; the Student's t test. Scale bars indicate 10 μm (C, E, and F).
Figure 7.
Figure 7.
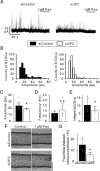
JP2 facilitates the efficiency of STOCs in mMASMCs. A, STOCs were recorded in siControl and siJP2-treated myocytes at a holding potential of −20 mV. STOCs were completely blocked by 1 μm paxilline (Pax). B, distribution histogram of STOC events versus their peak amplitude. C–E, summary of the mean STOC amplitude, frequency and integral for 30 s in myocytes treated with siControl (9 cells from 6 mice) or siJP2 (8 cells from 7 mice). F, images of vasocontractions caused by 1 μm Pax. The averaged diameter (μm) for: siControl, 125.7 ± 9.2 (Control) and 116.8 ± 10.0 (1 μm Pax); siJP2, 133.5 ± 14.6 (Control) and 130.5 ± 13.1 (1 μm Pax). G, summarized data of 1 μm Pax-induced decreases in the diameter of mesenteric arteries treated with siControl (n = 4 from 3 mice) and siJP2 (n = 4 from 3 mice). *, p < 0.05; **, p < 0.01; the Student's t test. The scale bar indicates 100 μm in F. n.s., not significant.

Similar articles

Cited by

References

    1. Berridge M. J. (2006) Calcium microdomains: organization and function. Cell Calcium 40, 405–412 10.1016/j.ceca.2006.09.002 - DOI - PubMed
    1. Takeshima H., Komazaki S., Nishi M., Iino M., and Kangawa K. (2000) Junctophilins: a novel family of junctional membrane complex proteins. Mol. Cell 6, 11–22 - PubMed
    1. Nishi M., Mizushima A., Nakagawara K., and Takeshima H. (2000) Characterization of human junctophilin subtype genes. Biochem. Biophys. Res. Commun. 273, 920–927 10.1006/bbrc.2000.3011 - DOI - PubMed
    1. Franzini-Armstrong C., and Protasi F. (1997) Ryanodine receptors of striated muscles: a complex channel capable of multiple interactions. Physiol. Rev. 77, 699–729 10.1152/physrev.1997.77.3.699 - DOI - PubMed
    1. Bers D. M. (2002) Cardiac excitation-contraction coupling. Nature 415, 198–205 10.1038/415198a - DOI - PubMed

Publication types