. 2019 Aug 5;218(8):2564-2582.
doi: 10.1083/jcb.201811148. Epub 2019 Jul 15.

The RNA exosome nuclease complex regulates human embryonic stem cell differentiation

Affiliations

The RNA exosome nuclease complex regulates human embryonic stem cell differentiation

Cedric Belair et al. J Cell Biol. .

Abstract

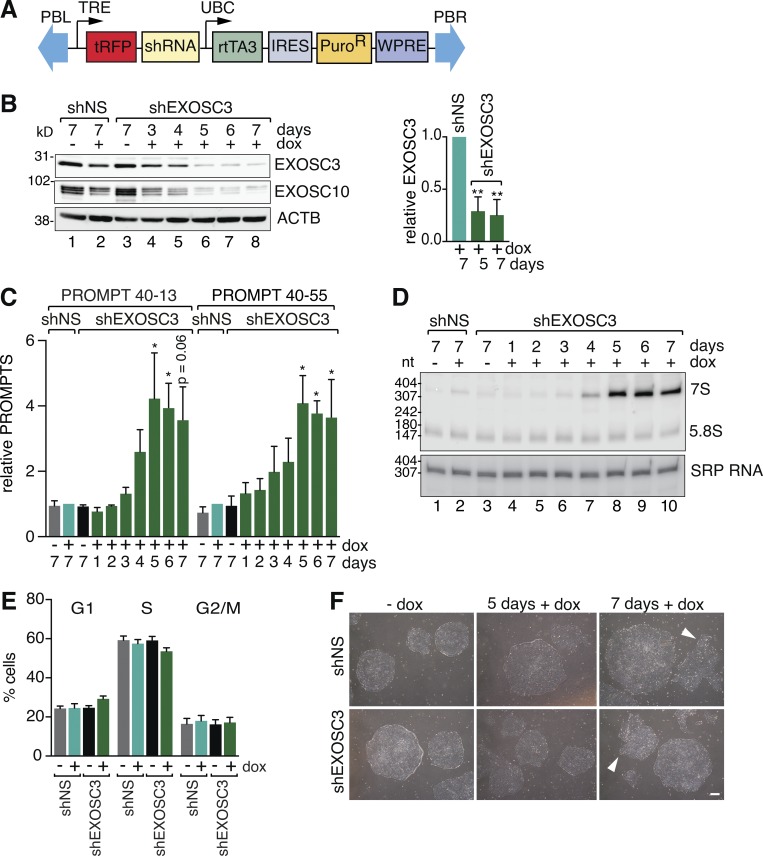
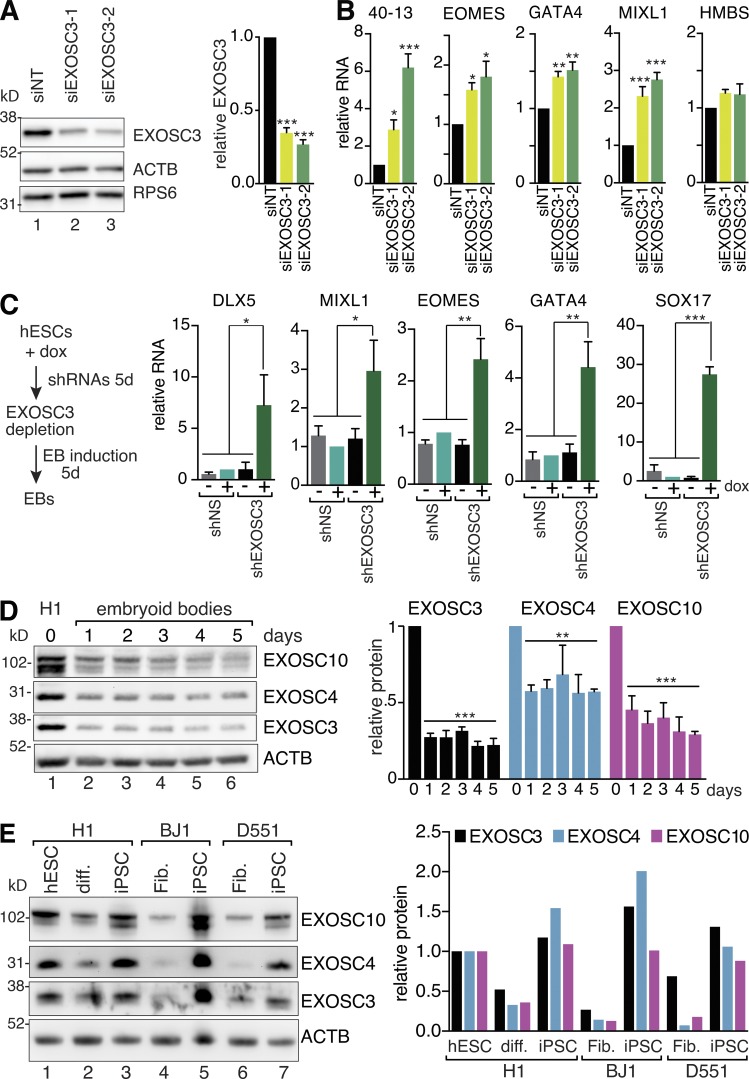
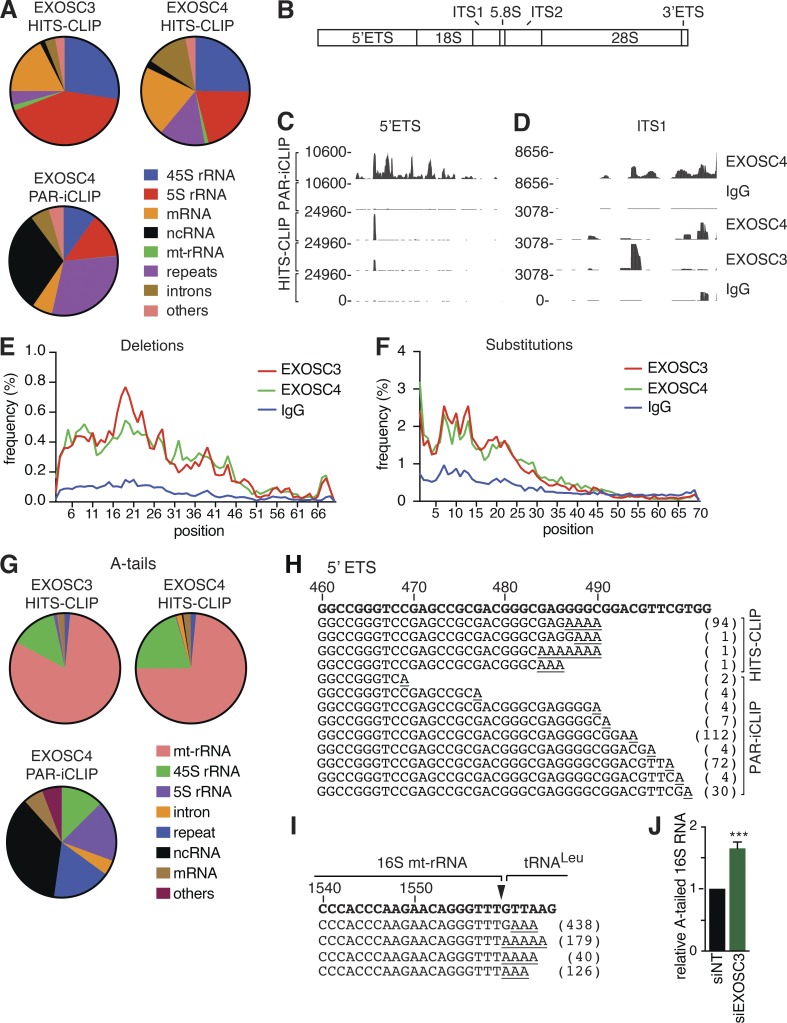
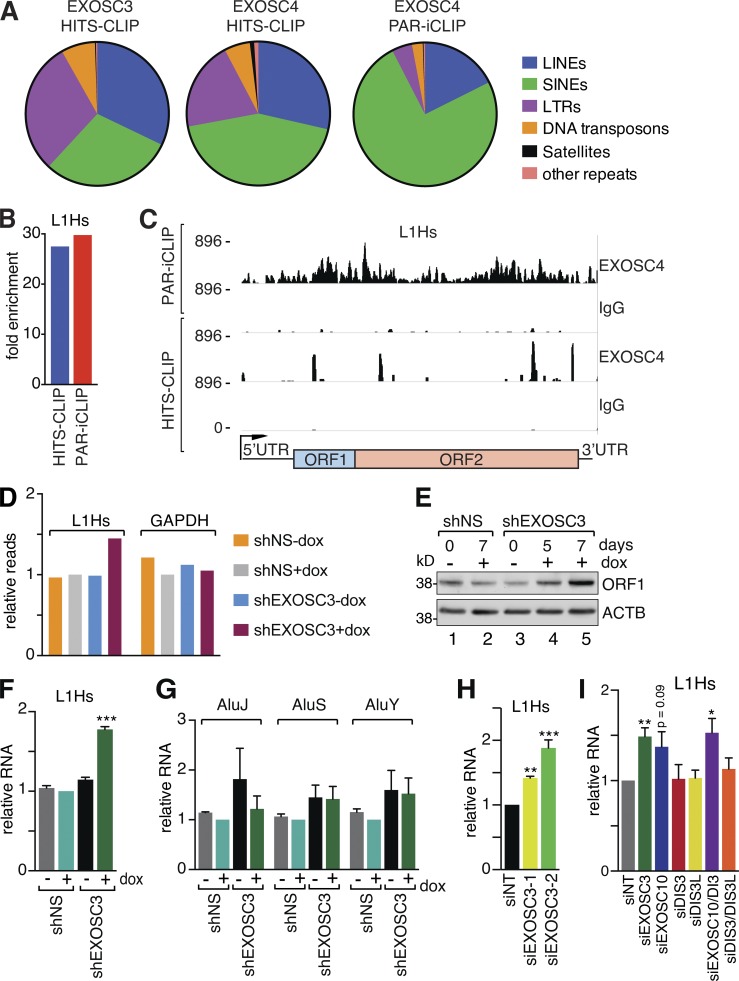
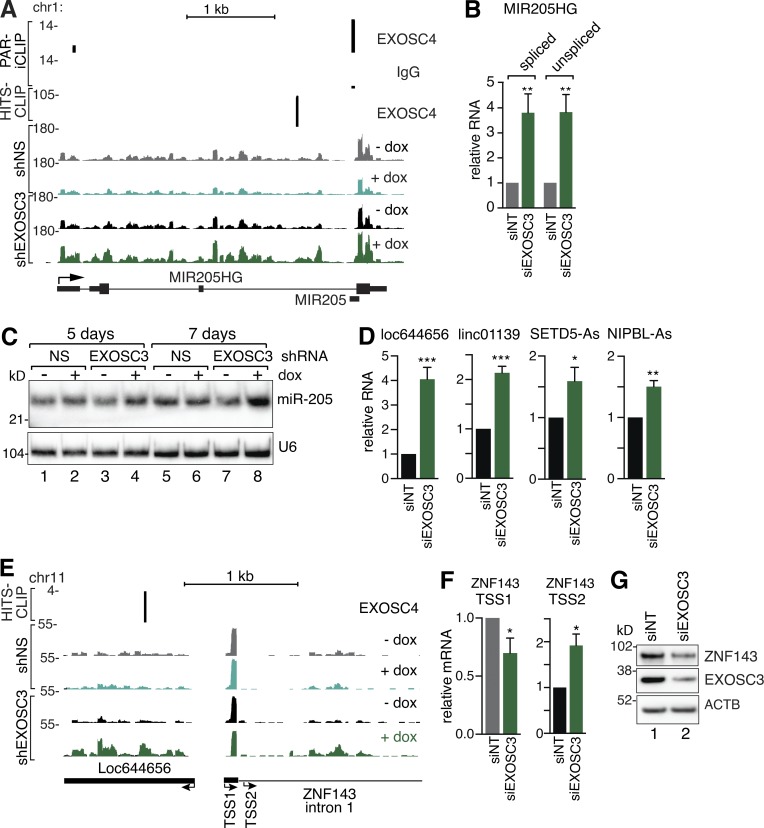
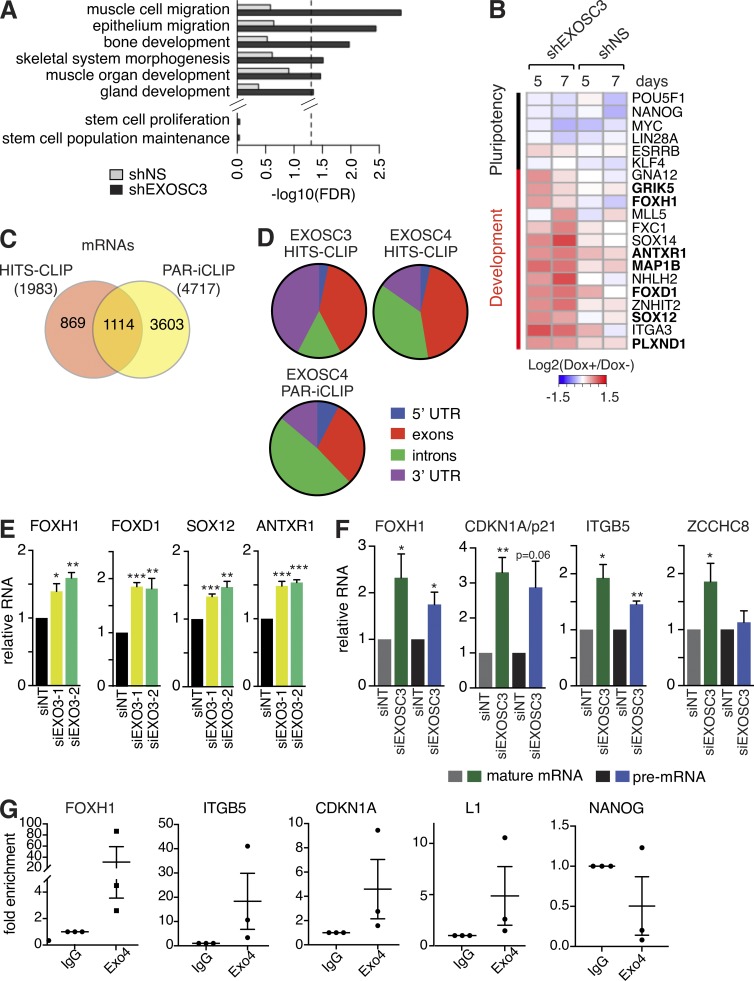
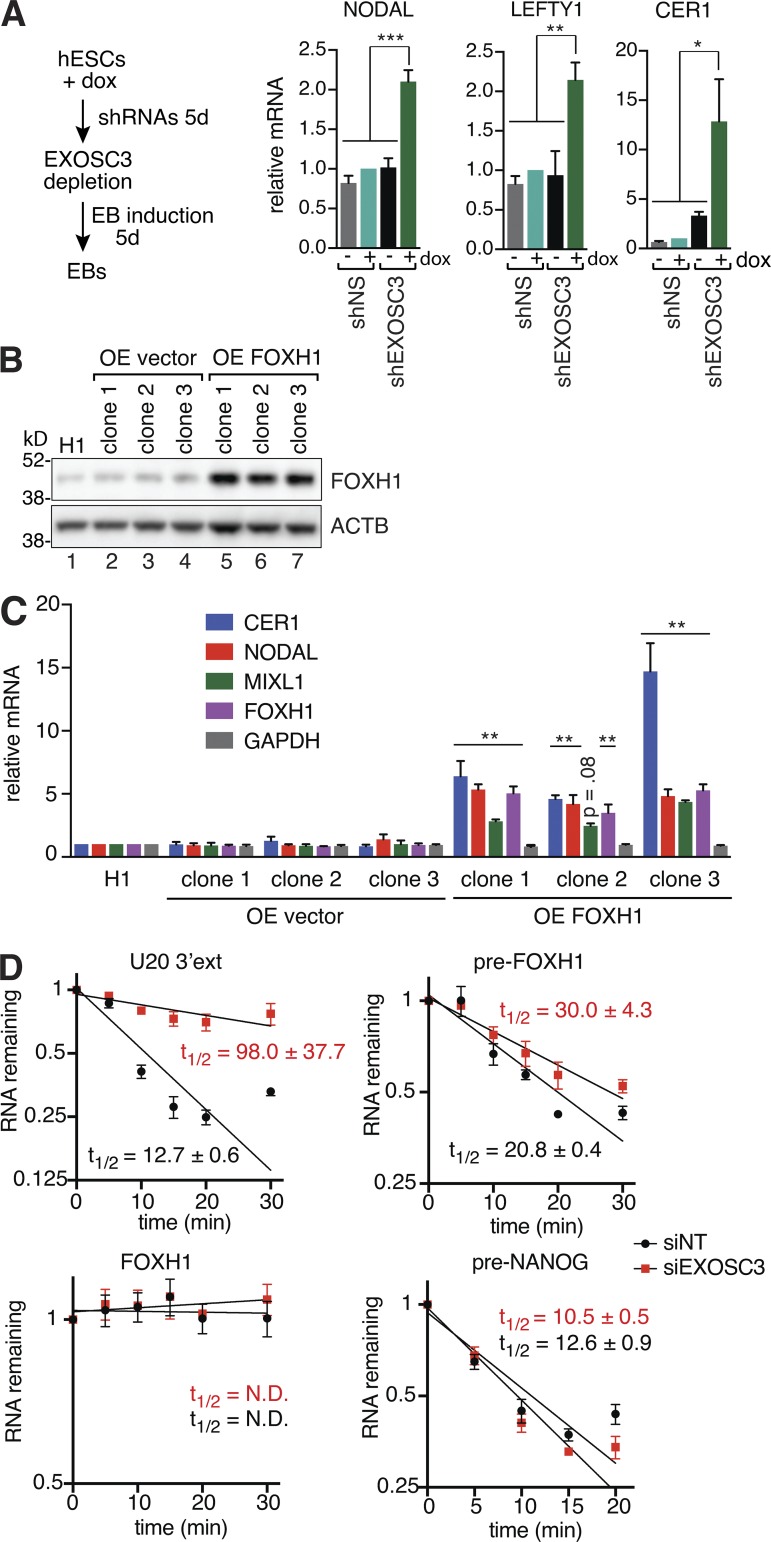
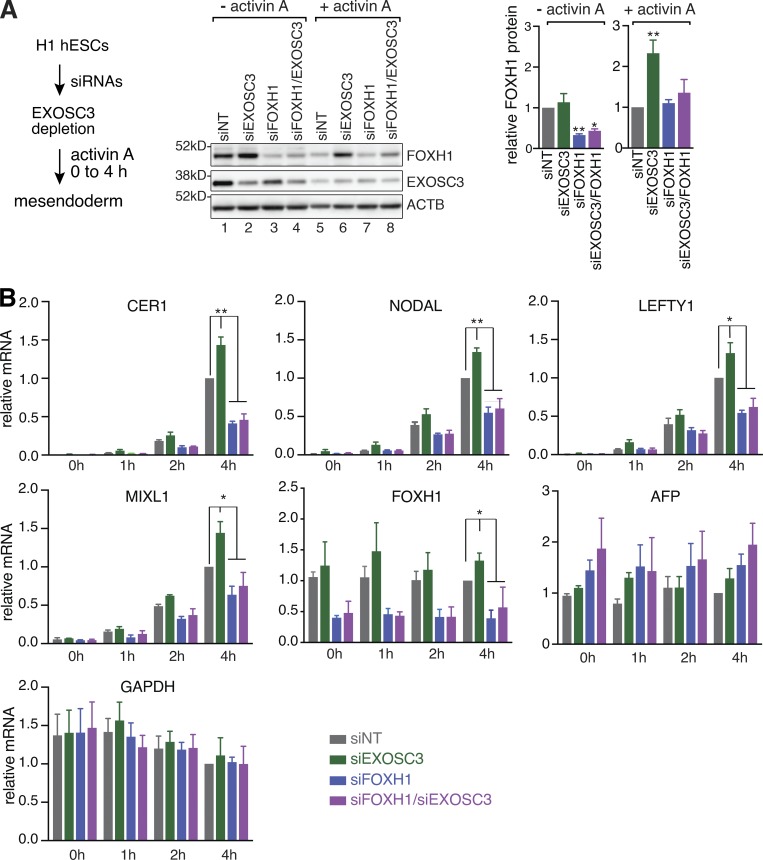
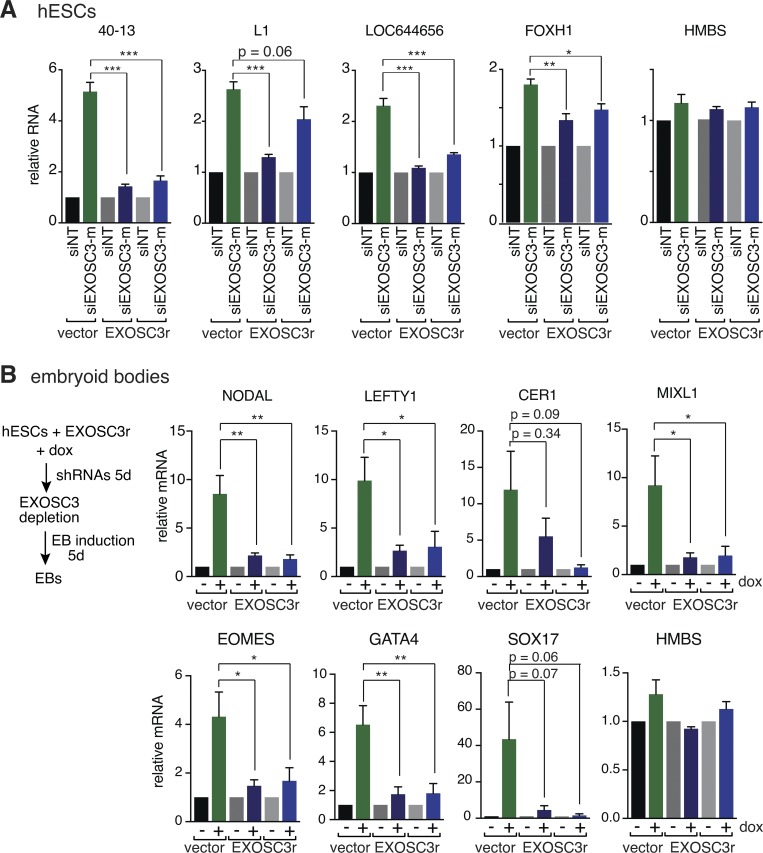
A defining feature of embryonic stem cells (ESCs) is the ability to differentiate into all three germ layers. Pluripotency is maintained in part by a unique transcription network that maintains expression of pluripotency-specific transcription factors and represses developmental genes. While the mechanisms that establish this transcription network are well studied, little is known of the posttranscriptional surveillance pathways that degrade differentiation-related RNAs. We report that the surveillance pathway mediated by the RNA exosome nuclease complex represses ESC differentiation. Depletion of the exosome expedites differentiation of human ESCs into all three germ layers. LINE-1 retrotransposons and specific miRNAs, lncRNAs, and mRNAs that encode developmental regulators or affect their expression are all bound by the exosome and increase in level upon exosome depletion. The exosome restrains differentiation in part by degrading transcripts encoding FOXH1, a transcription factor crucial for mesendoderm formation. Our studies establish the exosome as a regulator of human ESC differentiation and reveal the importance of RNA decay in maintaining pluripotency.


Figures

Figure 1.
Figure 1.
Strategy for exosome depletion. (A) Construct for EXOSC3 depletion. The tetracycline response element (TRE) drives expression of turboRFP and EXOSC3 shRNA. The ubiquitin C (UBC) promoter drives expression of the rtTA3 transactivator 3, an internal ribosome entry site (IRES) and a puromycin resistance marker (PuroR). The woodchuck hepatitis posttranscriptional regulatory element (WPRE) enhances expression. The construct is flanked by left and right piggyBac repeat termini (PBL and PBR, respectively). (B) After growing hESCs expressing shEXOSC3 (lanes 3–8) or control shRNAs (shNS; lanes 1 and 2) with (+) or without (−) doxycyline for the indicated days, lysates were subjected to immunoblotting. ACTB, loading control. Right: EXOSC3 quantitation. Data are mean ± SEM (n = 3) compared with shNS cells in doxycycline and normalized to ACTB. (C) RNA from shEXOSC3- or shNS-expressing cells grown with or without doxycycline was subjected to RT-qPCR to detect two PROMPTs. Normalization was to ACTB. Data are mean ± SEM (n = 3) relative to shNS cells in doxycycline. (D) RNA from shRNA-expressing cells grown with or without doxycycline was subjected to Northern blotting to detect the 7S precursor to 5.8S rRNA. Signal recognition particle RNA (SRP RNA), loading control. (E) Cell cycle analyses of shEXOSC3- and shNS-expressing hESCs grown for 5 d with or without doxycycline. BrdU incorporation was measured by flow cytometry. Data are mean ± SEM (n = 5). (F) Morphology of hESC colonies expressing EXOSC3 or nonsilencing shRNAs grown with or without doxycycline (dox) for 5 or 7 d. Arrowheads show colonies with minor morphological changes. Scale bar, 220 µm. P values were calculated with one-way ANOVA. *, P < 0.05; **, P < 0.01.
Figure 2.
Figure 2.
The exosome restrains hESC differentiation. (A) After transfecting hESCs with nontarget (siNT) or two siEXOSC3 RNAs, lysates were subjected to immunoblotting to detect EXOSC3. ACTB and RPS6 are loading controls. Right: EXOSC3 quantitation. Data are mean ± SEM (n = 3), normalized to RPS6. (B) After treating hESCs with siNT or siEXOSC3 RNAs, the indicated RNAs were measured by RT-qPCR. HMBS encodes a housekeeping enzyme, hydroxymethylbilane synthase. Data are mean ± SEM (n = 4), relative to siNT-treated cells and normalized to ACTB. (C) After growing hESCs expressing EXOSC3 or nonsilencing shRNAs with or without doxycycline for 5 d, EB formation was induced and the cells were cultured an additional 5 d. The indicated mRNAs were detected by RT-qPCR. Data are mean ± SEM (n = 3), relative to shNS EBs in doxycycline and normalized to ACTB. (D) EXOSC10, EXOSC4, and EXOSC3 levels in WT H1 cells (lane 1) and the corresponding EBs after 1–5 d of induction were assessed by immunoblotting (lanes 2–6). Right: Quantitation. Proteins were normalized to ACTB. Data are mean ± SEM (n = 3) relative to day 0. (E) Levels of the indicated subunits were compared by immunoblotting H1 hESCs (lane 1), three primary somatic cell lines (H1 differentiated cells, BJ1 neonatal foreskin fibroblasts [BJ1] and Detroit 551 [D551] fetal cells; lanes 2, 4, and 6), and iPSCs derived from each cell line (lanes 3, 5 and 7). Right: Quantitation of the blot shown (n = 1). P values were calculated with one-way ANOVA. *, P < 0.05; **, P < 0.01; ***, P < 0.001.
Figure 3.
Figure 3.
HITS-CLIP identifies known and new targets of the RNA exosome. (A) Distribution of tags from HITS-CLIP and PAR-iCLIP. (B) Cartoon of human ribosomal DNA, showing the 5′ETS, 18S rRNA, first internal transcribed spacer (ITS1), 5.8S rRNA, second internal transcribed spacer (ITS2), 28S rRNA, and 3′ETS. (C and D) HITS-CLIP and PAR-iCLIP reads mapping to the 5′ETS (C) and ITS1 (D). (E and F) Positions of deletions (E) and substitutions (F) in EXOSC3, EXOSC4, and IgG HITS-CLIP reads relative to the 5′ ends of the reads. (G) Distribution of HITS-CLIP and PAR-iCLIP reads containing nontemplated A tails. (H) Representative adenylated reads mapping to the 5′ETS. Genomic sequence is at the top. The number of reads is in parentheses. (I) Adenylated reads mapping to the 16S mt-rRNA 3′ end. Genomic sequence is at the top. Arrowhead, 16S mt-rRNA 3′ end. The number of reads is in parentheses. (J) RT-qPCR quantitation of polyadenylated 16S mt-rRNA in cells treated with EXOSC3 or NT siRNAs. Data are mean ± SEM (n = 4), normalized to ACTB. P values were calculated using two-tailed unpaired t test. ***, P < 0.001.
Figure 4.
Figure 4.
The exosome reduces L1 RNA levels. (A) Distribution of tags mapping to repeat elements. (B) Enrichment of EXOSC4 HITS-CLIP and PAR-iCLIP tags mapping to a retrotransposition-competent L1Hs element. Bars show the ratio of EXOSC4 reads compared with control IgG. (C) Distribution of tags mapping to a L1Hs consensus sequence. (D) RNA-seq reads for L1Hs elements from hESCs grown with or without doxycycline for 7 d. Read counts are normalized by the total reads in each library, relative to shNS cells in doxycycline (n = 1). (E) Lysates were subjected to immunoblotting to detect ORF1p. ACTB, loading control. (F and G) RT-qPCR analyses of L1Hs (F) or AluY, AluS, and AluJ RNA levels (G) in shNS and shEXOSC3-expressing cells grown with or without doxycycline for 7 d. Data are mean ± SEM (n = 3). Normalization was to ACTB relative to shNS cells in doxycycline. (H and I) After transfecting hESCs with individual (H) or siRNA pools (I), L1Hs RNAs were measured by RT-qPCR. Data are mean ± SEM (n = 3). Normalization was to ACTB, relative to siNT-transfected cells. P values were calculated with one-way ANOVA. *, P < 0.05; **, P < 0.01; ***, P < 0.001.
Figure 5.
Figure 5.
The exosome regulates levels of specific pre-miRNAs and lncRNAs. (A) EXOSC4-bound CLIP and RNA-seq reads mapping to MIR205HG. For RNA-seq, hESCs were grown with or without doxycycline for 7 d. (B) RT-qPCR analyses of MIR205HG transcripts in siNT- and siEXOSC3-treated cells. Data are mean ± SEM (n = 6). Normalization was to ACTB, relative to siNT cells. (C) RNA from shNS- (lanes 1, 2, 5, and 6) or shEXOSC3-expressing (lanes 3, 4, 7, and 8) cells grown with or without doxycycline for 5 or 7 d was subjected to Northern blotting to detect miR-205. U6 RNA, loading control. (D) Levels of the indicated lncRNAs were measured by RT-qPCR in hESCs transfected with siEXOSC3 or siNT RNAs. Data are mean ± SEM (n = 4). Normalization was to ACTB, relative to siNT-transfected cells. (E) EXOSC4-bound fragments and RNA-seq reads mapping to LOC644656 and the 5′ portion of ZNF143. ZNF143 TSSs (TSS1 and TSS2) are indicated. (F) Transcripts from TSS1 or TSS2 were measured by RT-qPCR in siEXOSC3 or siNT-treated hESCs. Data are mean ± SEM (n = 4). (G) Levels of ZNF143 and EXOSC3 in siNT- and siEXOSC3-treated hESCs were analyzed by immunoblotting. ACTB, loading control. P values were calculated with two-tailed unpaired t tests. *, P < 0.05; **, P < 0.01; ***, P < 0.001.
Figure 6.
Figure 6.
Exosome targets include mRNAs with roles in development and gene regulation. (A) Significant GO terms for differentially expressed genes after 5 and 7 d of doxycycline treatment in shNS and shEXOSC3-expressing hESCs. Dashed line, 0.05 false discovery rate cutoff. (B) Heat map showing expression changes of representative genes important for pluripotency and differentially expressed genes important for development. Genes in bold were exosome targets in HITS-CLIP and PAR-iCLIP. (C) Venn diagram showing the number of mRNAs bound by the exosome in HITS-CLIP and PAR-iCLIP, along with mRNAs identified by both techniques. (D) HITS-CLIP and PAR-iCLIP reads mapping to mRNA 5′ UTRs, introns, exons, and 3′ UTRs. (E and F) Levels of the indicated mRNAs and pre-mRNAs in hESCs transfected with individual (E) or pooled (F) siRNAs against EXOSC3 were measured by RT-qPCR. Data are mean ± SEM (n = 3). Normalization was to ACTB, relative to siNT-treated cells. (G) After UV cross-linking and immunoprecipitation, levels of the indicated RNAs were measured by RT-qPCR. The fold enrichment of each RNA in anti-EXOSC4 immunoprecipitates compared with IgG controls is shown. Data are mean ± SEM (n = 3). P values were calculated with two-tailed unpaired t tests. *, P < 0.05; **, P < 0.01; ***, P < 0.001.
Figure 7.
Figure 7.
Increased FOXH1 is sufficient to activate ME marker transcription. (A) RT-qPCR analysis of NODAL, LEFTY1 and CER1 mRNAs in EXOSC3-depleted EBs. After culturing hESCs for 5 d, EBs were induced for another 5 d. Data are mean ± SEM (n = 3), relative to shNS cells in doxycycline and normalized to ACTB. (B) FOXH1 protein was detected by immunoblotting in WT H1, control vector overexpressing (OE vector), and FOXH1 mRNA-overexpressing (OE FOXH1) hESC clones. (C) RT-qPCR quantitation of CER1, NODAL, MIXL1, FOXH1, and control GAPDH mRNAs in WT H1 hESCs and H1 cells with empty vector (OE vector) or overexpressing FOXH1 (OE FOXH1). Data are mean ± SEM (n = 4). RNAs were normalized to ACTB relative to H1 hESCs. (D) After depletion with EXOSC3-2 or NT siRNAs, hESCs were incubated with 50 µM DRB. At the times shown, levels of the indicated RNAs were determined by RT-qPCR. To determine relative abundance and to calculate half-lives, mRNA levels were normalized to 18S rRNA, relative to t = 0 min. Data are mean ± SEM (n = 3). P values were calculated with one-way ANOVA. *, P < 0.05; **, P < 0.01; ***, P < 0.001.
Figure 8.
Figure 8.
Exosome degradation of FOXH1 mRNA regulates ME formation. (A) FOXH1 was quantitated by immunoblotting in siNT-, siEXOSC3-, and/or siFOXH1-treated cells with or without activin A treatment. Right: Quantitation of three biological replicates. Data are mean ± SEM (n = 3) normalized to ACTB and relative to siNT cells. (B) FOXH1 targets (CER1, NODAL, LEFTY1, and MIXL1) and control mRNAs (AFP and GAPDH) in cells treated with the indicated siRNAs and incubated with activin A were measured by RT-qPCR. FOXH1 mRNA levels are also shown. Data are mean ± SEM (n = 4). RNAs were normalized to ACTB relative to siNT-treated cells after 4 h. P values were calculated with one-way ANOVA. *, P < 0.05; **, P < 0.01.
Figure 9.
Figure 9.
An shRNA-resistant transgene rescues phenotypes of exosome depletion. (A) shEXOSC3-expressing H1 hESCs carrying an empty vector or the shRNA-resistant EXOSC3 (EXOSC3r) transgene were treated with an siRNA that mimics mature shEXOSC3 RNA (siEXOSC3-m). RNAs were measured by RT-qPCR, normalized to ACTB, relative to the same cells treated with NT siRNA. Data are mean ± SEM (n = 4). (B) After 5 d of growth with or without doxycycline, H1 hESCs carrying empty vector or the shRNA-resistant EXOSC3 transgene were differentiated into EBs for an additional 5 d. Levels of the indicated mRNAs were measured by RT-qPCR. Data are mean ± SEM (n = 4). RNAs were normalized to ACTB relative to the same cells without doxycycline. P values were calculated with one-way ANOVA. *, P < 0.05; **, P < 0.01; ***, P < 0.001.

Comment in

Similar articles

Cited by

References

    1. Bailey S.D., Zhang X., Desai K., Aid M., Corradin O., Cowper-Sal Lari R., Akhtar-Zaidi B., Scacheri P.C., Haibe-Kains B., and Lupien M.. 2015. ZNF143 provides sequence specificity to secure chromatin interactions at gene promoters. Nat. Commun. 2:6186 10.1038/ncomms7186 - DOI - PMC - PubMed
    1. Bao W., Kojima K.K., and Kohany O.. 2015. Repbase Update, a database of repetitive elements in eukaryotic genomes. Mob. DNA. 6:11 10.1186/s13100-015-0041-9 - DOI - PMC - PubMed
    1. Beck C.R., Garcia-Perez J.L., Badge R.M., and Moran J.V.. 2011. LINE-1 elements in structural variation and disease. Annu. Rev. Genomics Hum. Genet. 12:187–215. 10.1146/annurev-genom-082509-141802 - DOI - PMC - PubMed
    1. Belair C., Sim S., and Wolin S.L.. 2018. Noncoding RNA Surveillance: The Ends Justify the Means. Chem. Rev. 118:4422–4447. 10.1021/acs.chemrev.7b00462 - DOI - PMC - PubMed
    1. Bernstein B.E., Mikkelsen T.S., Xie X., Kamal M., Huebert D.J., Cuff J., Fry B., Meissner A., Wernig M., Plath K., et al. . 2006. A bivalent chromatin structure marks key developmental genes in embryonic stem cells. Cell. 125:315–326. 10.1016/j.cell.2006.02.041 - DOI - PubMed

Publication types

MeSH terms