. 2019 Jul 30;116(31):15580-15589.
doi: 10.1073/pnas.1902046116. Epub 2019 Jul 15.

Historical reconstruction unveils the risk of mass mortality and ecosystem collapse during pancontinental megadrought

Affiliations

Historical reconstruction unveils the risk of mass mortality and ecosystem collapse during pancontinental megadrought

Robert C Godfree et al. Proc Natl Acad Sci U S A. .

Abstract

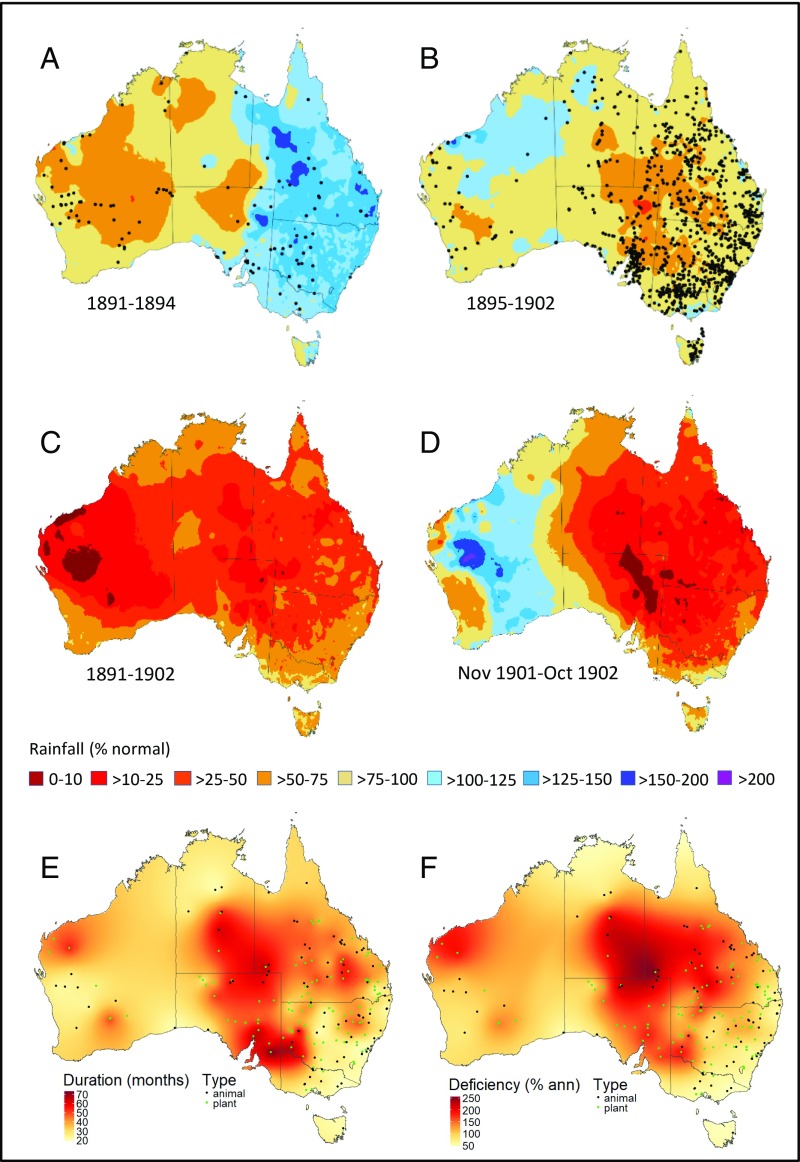
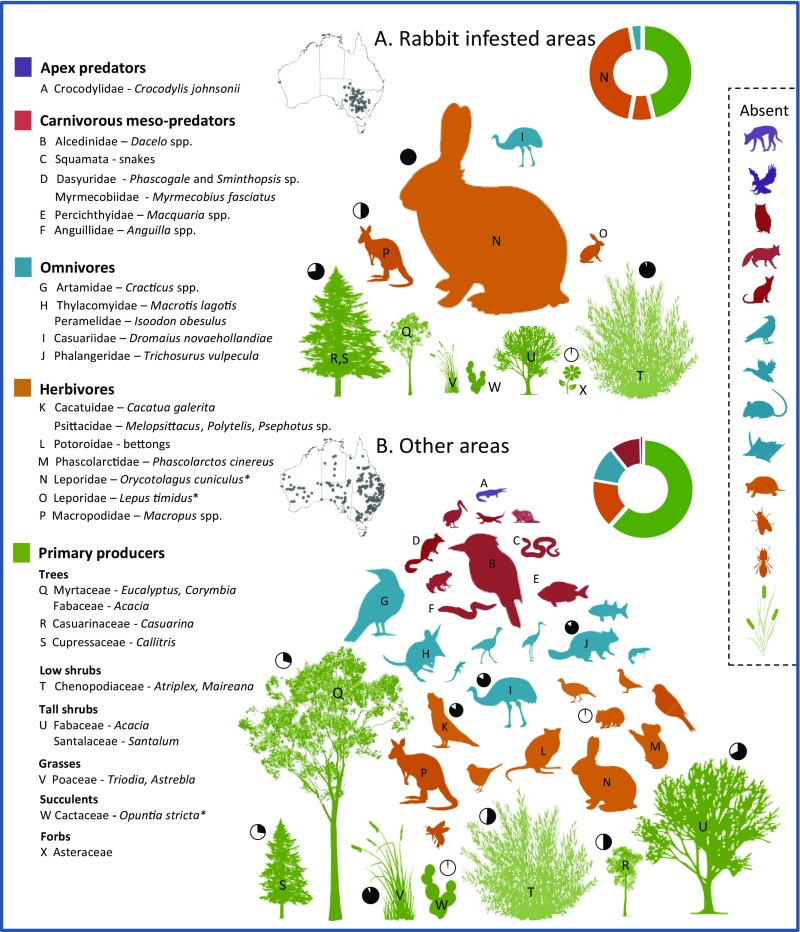
An important new hypothesis in landscape ecology is that extreme, decade-scale megadroughts can be potent drivers of rapid, macroscale ecosystem degradation and collapse. If true, an increase in such events under climate change could have devastating consequences for global biodiversity. However, because few megadroughts have occurred in the modern ecological era, the taxonomic breadth, trophic depth, and geographic pattern of these impacts remain unknown. Here we use ecohistorical techniques to quantify the impact of a record, pancontinental megadrought period (1891 to 1903 CE) on the Australian biota. We show that during this event mortality and severe stress was recorded in >45 bird, mammal, fish, reptile, and plant families in arid, semiarid, dry temperate, and Mediterranean ecosystems over at least 2.8 million km2 (36%) of the Australian continent. Trophic analysis reveals a bottom-up pattern of mortality concentrated in primary producer, herbivore, and omnivore guilds. Spatial and temporal reconstruction of premortality rainfall shows that mass mortality and synchronous ecosystem-wide collapse emerged in multiple geographic hotspots after 2 to 4 y of severe (>40%) and intensifying rainfall deficits. However, the presence of hyperabundant herbivores significantly increased the sensitivity of ecosystems to overgrazing-induced meltdown and permanent ecosystem change. The unprecedented taxonomic breadth and spatial scale of these impacts demonstrate that continental-scale megadroughts pose a major future threat to global biodiversity, especially in ecosystems affected by intensive agricultural use, trophic simplification, and invasive species.

Keywords: Federation Drought; ecosystem collapse; mass mortality; megadrought; trophic impact.


Conflict of interest statement

The authors declare no conflict of interest.

Figures

Fig. 1.
Fig. 1.
Rainfall patterns and duration and magnitude of drought during the 1891 to 1903 study period. (A) Mean rainfall from 1891 to 1894 as a percentage of the 1889 to 2015 average, showing multiannual drought in central and western Australia. Black dots indicate geographic locations of drought records during the time period, which partly reflect the pattern of European settlement at the time. (B) As in A except for 1895 to 1902. (C) Minimum annual rainfall as percentage of average, 1891 to 1902. Most of the continent between 18°S and 32°S experienced at least one calendar year with <50% of average annual rainfall. (D) Hyperintense drought between November 1901 and October 1902, with much of eastern Australia receiving <25% of average rainfall. (E) Reconstructed continental profile of drought duration before mortality of biota, defined as the number of preceding months of continuous drought (DCON). (F) Continental profile of drought magnitude (RCON) before mortality of biota, defined as the cumulative rainfall deficiency over the period DCON expressed as a percentage of annual mean rainfall PAV. See Materials and Methods for further details.
Fig. 2.
Fig. 2.
Spatial distribution of drought impacts on flora and fauna during the FDP. (A) Modularity analysis of taxonomic co-occurrence network based on stress and mortality records. Modules are: red = predominately arid zone mixed animal and plant assemblages; green = subtropical to arid woodlands, shrublands, savannas, and grasslands; orange = inland birds and marsupials; blue = fish and minor animal taxa; and yellow = predominantly Mediterranean to arid woody shrubland containing O. cuniculus (European rabbit). Module roles: 1) ultraperipheral node, 2) peripheral node, 3) nonhub connector, and 4) connector hub (49). (BD) Locations of mass mortality by area (Ma) and number (Mn) and population collapse to near-extirpation (NE) and extirpation (E) for native animals (B), plants (C), and O. cuniculus (D). The categories for Ma, NE, and E are as follows: 1 = local (<10 km scale), 2 = district (10 to <100 km) or 3 = regional (>100 km); the categories for Mn are 1) 102 to 103, 2) 104 to 105, and 3) 106+. Biotic groups are: Ac = Actinopterygii, Am = Amphibia, Av = Aves, Eu = Eutheria, M = Marsupialia, Ml = Malacostraca, I = Insecta, R= Reptilia, F = forbs, G = grasses, LS = low shrubs, TS = tall shrubs, Tr = trees, M-All = mixed all (animal and plant), M-An = mixed animal, M-P = mixed plant, M-WP = mixed woody plant.
Fig. 3.
Fig. 3.
Trophic structure of drought mortality and stress across plant and animal taxa inside (A) and outside (B) areas infested with large populations of the European rabbit, O. cuniculus, showing declining impact at higher trophic levels. The size of a minimum circle surrounding each icon is directly proportional to the number of biotic impact records. Pie charts indicate the proportion of mortality records (black) vs. stress records (white). Examples of major groups for which few or no records exist (absent) are provided in each trophic level; from Top to Bottom: dingo (C. familiaris), raptors, owls, red fox (V. vulpes), feral cat (F. catus), crows and ravens (Corvidae), waterfowl (especially Anatinae), Muridae, gliders, turtles (especially Chelidae), flies, ants, and aquatic and riparian reeds, rushes, and other plants (including Phragmites, Typha). Introduced species.
Fig. 4.
Fig. 4.
Relationships between cumulative impact (percentage of total BIRs) of major taxonomic groups and rainfall across eastern Australia during the 1891 to 1903 study period outside (A and B) and inside (C) areas heavily infested by European rabbits. Cumulative rainfall residuals (heavy black lines) show above average rainfall between 1891 and 1894 in all areas, apart from a short period in late 1891 to early 1892, followed by establishment of semicontinuous drought in 1895 and continuous drought from 1898 to early 1903 (the Federation Drought; see Materials and Methods). The cumulative rainfall residual (relative to the 1889 to 2015 mean) is expressed as a percentage of mean annual rainfall; for example in C the cumulative rainfall residual for the period 1895 to 1903 was close to 200% of mean annual rainfall. Icons are as in Fig. 2.
Fig. 5.
Fig. 5.
Reconstructed rainfall patterns before mortality in native animals, native plants, and the European rabbit (O. cuniculus). (A) Cumulative rainfall deficit as a percentage of mean annual precipitation before mortality in birds, fish, marsupials, and other native animals outside of rabbit-infested areas. Shown are mean values of DCDM = months of consecutive below average precipitation, DCON = months of continuous drought, and DSCO = months of semicontinuous drought. (B) Rainfall deficits for birds, fish, marsupials, and other native animals in months 1 to 3, 4 to 6, 7 to 12, and years 2 through 8 before observed mortality. The solid black line indicates the cumulative count of BIR records as a percentage of the total at each time period. (C and D) As in A and B but for native plant groups (grasses, low shrubs, tall shrubs, trees). (E and F) As in A and B but for O. cuniculus inside heavily rabbit infested areas. Data for each BIR extend back in time only to terminal DCDM, DCON, or DSCO dates. The mean cumulative rainfall deficit value (y axis) can be determined for any period before the BIR observation.

References

    1. Naumann G., et al. , Global changes in drought conditions under different levels of warming. Geophys. Res. Lett. 45, 3285–3296 (2018).
    1. Zhao T., Dai A., The magnitude and causes of global drought changes in the 21st century under a low-moderate emissions scenario. J. Clim. 28, 4490–4512 (2015).
    1. Prudhomme C., et al. , Hydrological droughts in the 21st century, hotspots and uncertainties from a global multimodel ensemble experiment. Proc. Natl. Acad. Sci. U.S.A. 111, 3262–3267 (2014). - PMC - PubMed
    1. Stahle D. W., et al. , Major Mesoamerican droughts of the past millennium. Geophys. Res. Lett. 38, L05703 (2011).
    1. Cook B. I., Smerdon J. E., Seager R., Cook E. R., Pan-continental droughts in North America over the last millennium. J. Clim. 27, 383–397 (2014).

Publication types