. 2019 Jul 30;116(31):15625-15634.
doi: 10.1073/pnas.1906303116. Epub 2019 Jul 15.

An immunometabolic pathomechanism for chronic obstructive pulmonary disease

Affiliations

An immunometabolic pathomechanism for chronic obstructive pulmonary disease

Sara Bruzzaniti et al. Proc Natl Acad Sci U S A. .

Abstract

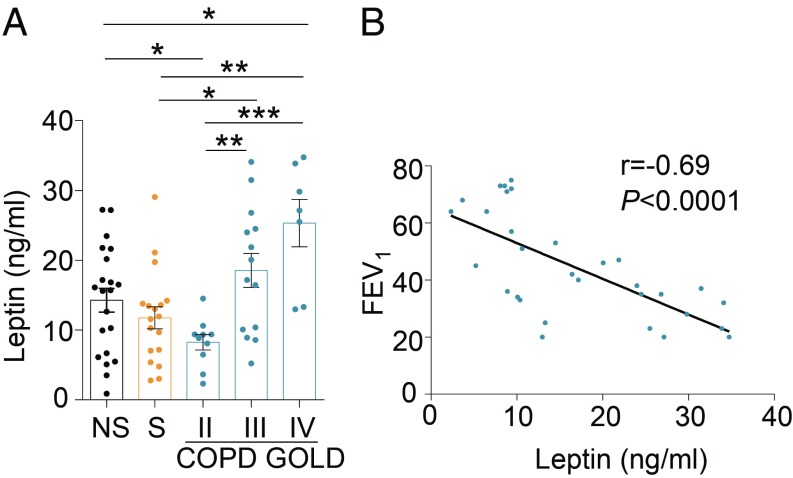
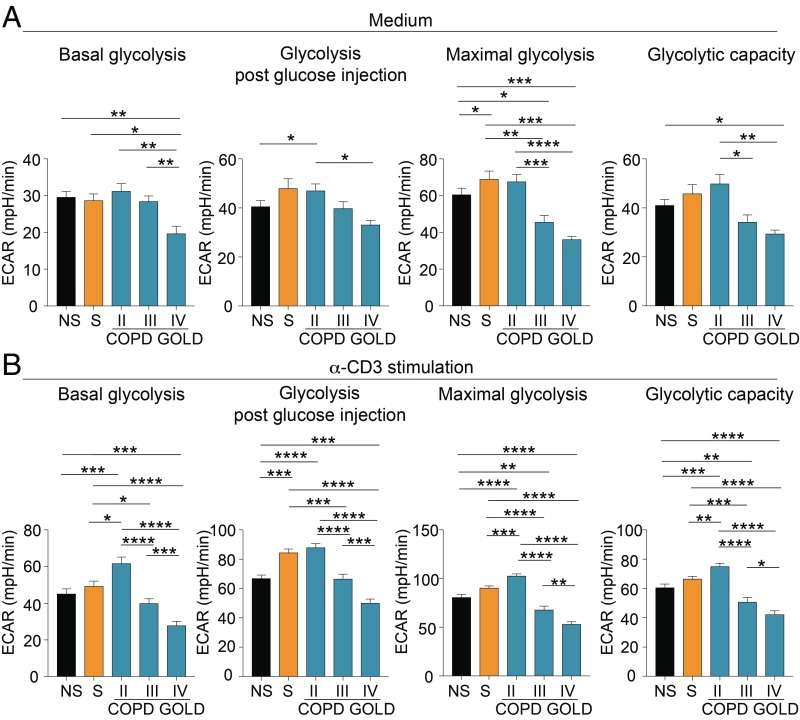
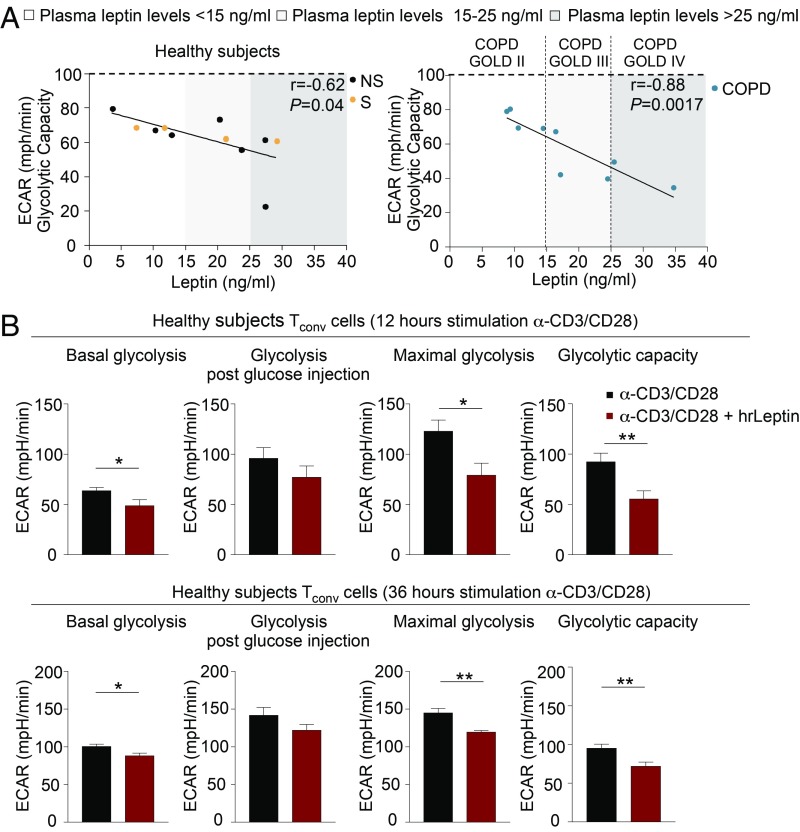
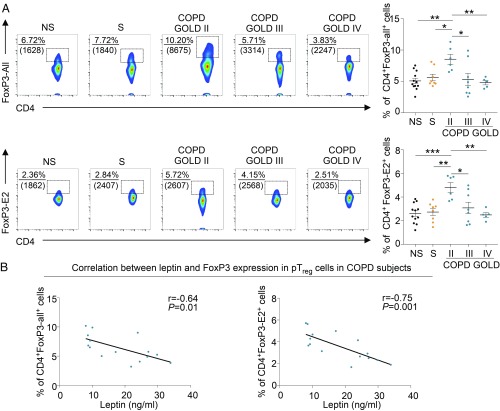
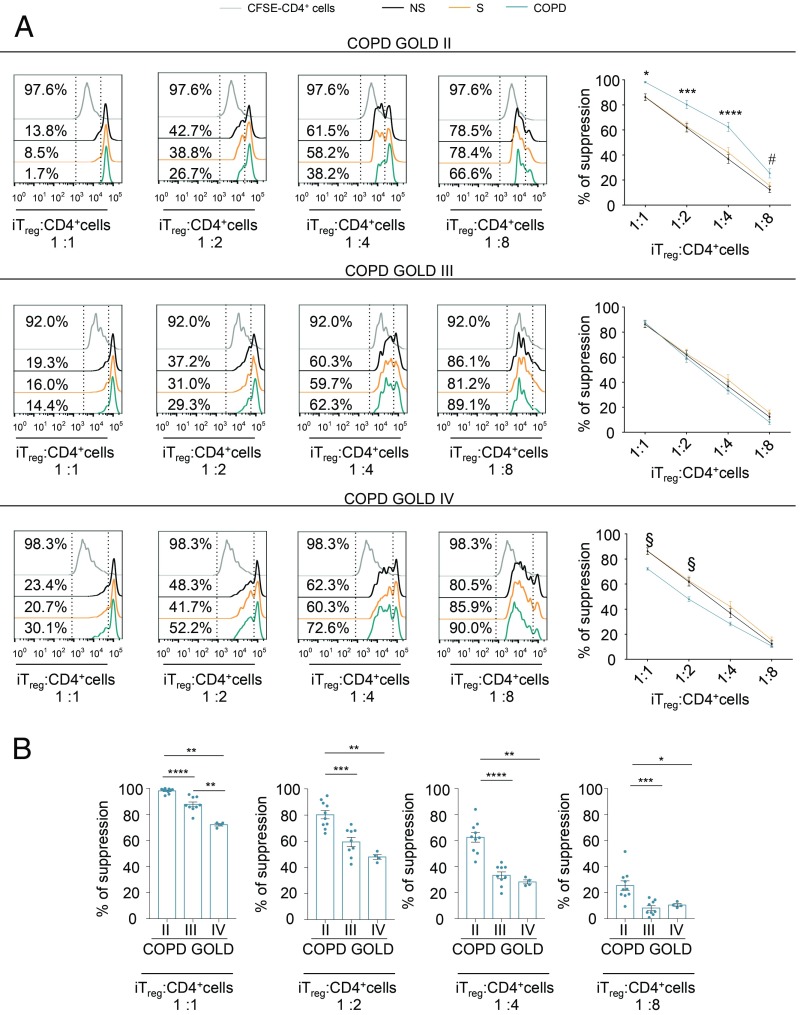
Chronic obstructive pulmonary disease (COPD) is an inflammatory condition associated with abnormal immune responses, leading to airflow obstruction. Lungs of COPD subjects show accumulation of proinflammatory T helper (Th) 1 and Th17 cells resembling that of autoreactive immune responses. As regulatory T (Treg) cells play a central role in the control of autoimmune responses and their generation and function are controlled by the adipocytokine leptin, we herein investigated the association among systemic leptin overproduction, reduced engagement of glycolysis in T cells, and reduced peripheral frequency of Treg cells in different COPD stages. These phenomena were also associated with an impaired capacity to generate inducible Treg (iTreg) cells from conventional T (Tconv) cells. At the molecular level, we found that leptin inhibited the expression of forkhead-boxP3 (FoxP3) and its splicing variants containing the exon 2 (FoxP3-E2) that correlated inversely with inflammation and weakened lung function during COPD progression. Our data reveal that the immunometabolic pathomechanism leading to COPD progression is characterized by leptin overproduction, a decline in the expression of FoxP3 splicing forms, and an impairment in Treg cell generation and function. These results have potential implications for better understanding the autoimmune-like nature of COPD and the pathogenic events leading to lung damage.

Keywords: COPD; immunometabolism; leptin; regulatory T cells.


Conflict of interest statement

The authors declare no conflict of interest.

Figures

Fig. 1.
Fig. 1.
Biphasic progression of leptin levels during COPD and its inverse correlation with lung function. (A) Plasma levels of leptin in NS healthy subjects, S healthy subjects, and COPD subjects at different GOLD stages. Data are from at least n = 7 subjects, data are expressed as mean ± SEM, and each symbol represents an individual healthy control or COPD subject as indicated. *P < 0.05; **P < 0.01; ***P < 0.001 by 2-tailed Mann–Whitney test. (B) Statistical correlation between plasma leptin levels and FEV1 as a measure of lung function. Data are from n = 31 subjects with COPD, and each symbol represents an individual COPD subject. r = −0.69, P < 0.0001 by Pearson’s correlation.
Fig. 2.
Fig. 2.
Impaired engagement of glycolysis of T cells from COPD subjects during disease progression. (A) Parameters of the glycolytic pathway in unstimulated PBMCs from NS healthy subjects, S healthy subjects, and COPD subjects at different GOLD stages. (B) Parameters of the glycolytic pathway of PBMCs upon 12 h of α-CD3 stimulation from NS, S, and COPD subjects at different GOLD stages. Parameters of the glycolytic pathway (in A and B) were calculated from the ECAR profile: basal glycolysis, glycolysis after glucose injection, maximal glycolysis (after oligomycin addition), and glycolytic capacity (calculated as the difference of oligomycin-induced ECAR and 2-deoxy-d-glucose (2DG)–induced ECAR). For A and B, data are from n = 7 independent experiments (at least n = 2 subjects in 3 technical replicates), and are expressed as mean ± SEM. *P < 0.05; **P < 0.01; ***P < 0.001; ****P < 0.0001 by 2-tailed Mann–Whitney test.
Fig. 3.
Fig. 3.
Leptin reduces glycolysis of T cells in COPD and healthy subjects. (A) Statistical correlation between plasma leptin levels and glycolytic capacity of TCR-stimulated PBMCs from NS and S healthy subjects (Left) and COPD individuals at different GOLD stages (Right). Different ranges of plasma leptin are indicated: white (<15 ng/mL), light gray (15 to 25 ng/mL), and dark gray (>25 ng/mL) boxes. Data are from n = 7 NS healthy subjects, n = 4 S healthy subjects, and n = 9 COPD subjects; each symbol represents an individual healthy or COPD subject as indicated. r = −0.62, P = 0.04 and r = −0.88, P = 0.0017 by Pearson’s correlation. (B) Parameters of the glycolytic pathway calculated from the ECAR profile in CD4+CD25 (Tconv) cells from healthy subjects stimulated for 12 h (Upper) or 36 h (Lower) with α-CD3/CD28 alone or in presence of hrLeptin. Data are from n = 2 independent experiments at least in 2 technical replicates, and are expressed as mean ± SEM. *P < 0.05; **P < 0.01 by 2-tailed Mann–Whitney test.
Fig. 4.
Fig. 4.
Peripheral (p)Treg cells expressing different FoxP3 splicing variants are reduced in different GOLD stages, and this reduction correlates with leptin levels in COPD. (A, Left) Representative flow cytometry plots show the percentage of CD4+FoxP3-all+ (Upper) and CD4+FoxP3-E2+ (Lower) cells in PBMCs from NS healthy subjects, S healthy subjects, and COPD subjects at different disease stages. Numbers in plots indicate the percentage of positive cells, and numbers in parentheses represent mean fluorescence intensity. (A, Right) Cumulative data of CD4+FoxP3-all+ (Upper) and CD4+FoxP3-E2+ (Lower) cells in PBMCs from NS, S, and COPD subjects at different GOLD stages. Data are from at least n = 5 subjects, and are expressed as mean ± SEM. Each symbol represents an individual healthy or COPD subject as indicated. *P < 0.05; **P < 0.01; ***P < 0.001 by 2-tailed Mann–Whitney test. (B, Left) Negative statistical correlation between frequency of circulating CD4+FoxP3-all+ cells and plasma leptin. (B, Right) Negative statistical correlation between frequency of circulating CD4+FoxP3-E2+ cells and plasma leptin. Data are from n = 15 COPD subjects. r = −0.64, P = 0.01 and r = −0.75, P = 0.001 by Pearson’s correlation.
Fig. 5.
Fig. 5.
Progressive reduction of Treg cell-specific markers in pTreg cells of COPD subjects at different GOLD stages. Cumulative data of the expression of Treg cell-specific markers (CTLA-4 and PD-1) and Ki-67 in peripheral CD4+FoxP3-all+ (Upper) and CD4+FoxP3-E2+ (Lower) cells in NS healthy subjects; S healthy subjects; and COPD subjects at GOLD II, GOLD III, and GOLD IV stages. Data are from at least n = 3 subjects, and are expressed as mean ± SEM. Each symbol represents an individual healthy or COPD subject as indicated. *P < 0.05; **P < 0.01 by 2-tailed Mann–Whitney test.
Fig. 6.
Fig. 6.
Defective induction of iTreg cells in COPD subjects is associated with GOLD stages and deterioration of lung function. (A, Upper) Flow cytometry plots show the expression of CD25 (Left), FoxP3-all (Center), and FoxP3-E2 (Right) as a measure of iTreg cell induction from TCR-stimulated Tconv cells (also SI Appendix, Fig. S9). Numbers in plots indicate the percentage of positive cells, and numbers in parentheses indicate mean fluorescence intensity. (A, Lower) Cumulative data of the percentage of induced CD25+ (Left), FoxP3-all+ (Center), and FoxP3-E2+ (Right) cells from TCR-stimulated Tconv cells in NS healthy subjects; S healthy subjects; and COPD subjects at GOLD II, GOLD III, and GOLD IV stages as indicated. Data are from at least n = 5 subjects, and are expressed as mean ± SEM. Each dot plot represents a single COPD or healthy subject as indicated. *P < 0.05; **P < 0.01; ***P < 0.001; ****P < 0.0001 by 2-tailed Mann–Whitney test. (B) Positive correlation between the percentage of either induced FoxP3-all+ (Left) or FoxP3-E2+ (Right) cells from TCR-stimulated Tconv cells with FEV1 in COPD subjects. Data are from n = 22 COPD subjects. Each dot plot represents a single COPD subject. r = 0.76, P < 0.0001 and r = 0.85, P < 0.0001 by Pearson’s correlation.
Fig. 7.
Fig. 7.
Progressive reduction of Treg cell-specific markers in induced Foxp3+ iTreg cells of COPD subjects at different GOLD stages. Cumulative data of the expression of Treg cell-specific markers (CTLA-4 and PD-1) and Ki-67 in induced FoxP3-all+ (Upper) and FoxP3-E2+ (Lower) cells from NS healthy subjects; S healthy subjects; and COPD subjects at GOLD stage II, GOLD stage III, and GOLD stage IV, as indicated, are shown. Data are from at least n = 5 subjects, and are expressed as mean ± SEM. Each symbol represents an individual healthy or COPD subject as indicated. *P < 0.05; **P < 0.01; ***P < 0.001 by 2-tailed Mann–Whitney test.
Fig. 8.
Fig. 8.
Leptin inversely correlates with FoxP3 expression and inhibits its induction in vitro. (A) Negative correlation between induction of FoxP3-all (Left) or FoxP3-E2 (Right) in TCR-stimulated Tconv cells and leptin levels. Data are from n = 15 COPD subjects. r = −0.72, P = 0.002 and r = −0.76, P = 0.001 by Pearson’s correlation. (B, Left) Representative flow cytometry plots show the percentage of induced FoxP3-all+ (Upper) and FoxP3-E2+ (Lower) cells, generated from Tconv cells of healthy subjects (in autologous donors, 5% plasma) stimulated for 10 d with α-CD3/CD28 plus human recombinant IL-2 (hrIL-2), in the presence of exogenous chronic hrLeptin (200 ng/mL) or in the presence of neutralizing α-Leptin (20 ng/mL) mAb. Numbers in the plots indicate the percentage of positive cells, and numbers in parentheses indicate mean fluorescence intensity of the marker. (B, Right) Cumulative data of percentage of induced FoxP3-all+ (Upper) and FoxP3-E2+ (Lower) cells, generated as above. Data are from n = 6 healthy subjects, and each point represents an individual healthy subject. *P < 0.05; **P < 0.01; ***P < 0.001 by paired repeated-measure 1-way ANOVA corrected for multiple comparisons Tukey test.
Fig. 9.
Fig. 9.
Suppressive function of iTreg cells declines with disease severity in COPD subjects. (A, Left) Flow cytometry histograms show proliferation of CFSE-labeled CD4+ T cells (from healthy donors) stimulated for 72 h in vitro with α-CD3/CD28 and cultured alone (gray curves) or in the presence of various numbers of flow-sorted iTreg cells (ratio from 1:1 to 1:8) from NS healthy subjects, S healthy subjects, and COPD patients at different disease stages. Numbers in plots indicate the percentage of CFSE dilution in CD4+ T cells cultured alone (Upper) or in the presence of iTreg cells from NS, S, and COPD subjects at different disease stages. The iTreg cells were flow-sorted as reported in the experimental procedure (SI Appendix, Fig. S13). (A, Right) Percentage of suppression exerted by iTreg cells in the above conditions. Data are from n = 3 independent experiments (at least n = 2 subjects in 2 technical replicates), and are expressed as mean ± SEM. *P < 0.05; ***P < 0.001; ****P < 0.0001 statistical significance between COPD at GOLD stage II and healthy (NS and S) controls. #P < 0.05 statistical significance between COPD patients at GOLD stage II and NS subjects by 2-way ANOVA corrected for multiple comparisons Tukey test. §P < 0.05 statistical significance between COPD patients at GOLD stage IV and S subjects by 2-way ANOVA corrected for multiple comparisons Tukey test. (B) Scatter plots with bar histograms show comparison of suppression ability exerted by iTreg cells (at the indicated ratio) isolated from COPD subjects on proliferation of CFSE-labeled CD4+ T cells stimulated for 72 h in vitro with α-CD3/CD28. Data are from n = 3 independent experiments (at least n = 2 COPD subjects in 2 technical replicates), and are expressed as mean ± SEM. *P < 0.05; **P < 0.01; ***P < 0.001; ****P < 0.0001 by 2-tailed Mann–Whitney test.

Similar articles

Cited by

References

    1. Barnes P. J., et al. , Chronic obstructive pulmonary disease. Nat. Rev. Dis. Primers 1, 15076 (2015). - PubMed
    1. Caramori G., et al. , COPD immunopathology. Semin. Immunopathol. 38, 497–515 (2016). - PMC - PubMed
    1. Cerami C., et al. , Tobacco smoke is a source of toxic reactive glycation products. Proc. Natl. Acad. Sci. U.S.A. 94, 13915–13920 (1997). - PMC - PubMed
    1. Cosio M. G., Saetta M., Agusti A., Immunologic aspects of chronic obstructive pulmonary disease. N. Engl. J. Med. 360, 2445–2454 (2009). - PubMed
    1. Rahman I., Adcock I. M., Oxidative stress and redox regulation of lung inflammation in COPD. Eur. Respir. J. 28, 219–242 (2006). - PubMed

Publication types

MeSH terms