

doi: 10.1038/s41467-019-10864-z.
Detection of cell-type-specific risk-CpG sites in epigenome-wide association studies
Affiliations
- PMID: 31308366
- PMCID: PMC6629651
- DOI: 10.1038/s41467-019-10864-z
Item in Clipboard
Detection of cell-type-specific risk-CpG sites in epigenome-wide association studies
Nat Commun.
.
Abstract
In epigenome-wide association studies, the measured signals for each sample are a mixture of methylation profiles from different cell types. Current approaches to the association detection claim whether a cytosine-phosphate-guanine (CpG) site is associated with the phenotype or not at aggregate level and can suffer from low statistical power. Here, we propose a statistical method, HIgh REsolution (HIRE), which not only improves the power of association detection at aggregate level as compared to the existing methods but also enables the detection of risk-CpG sites for individual cell types.
Conflict of interest statement
The authors declare no competing interests.
Figures
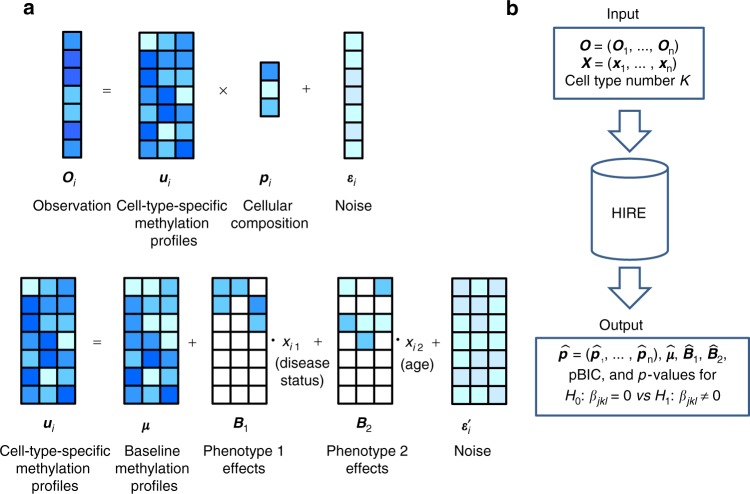
A simple cartoon illustration of the HIRE model with three cell types (K = 3) and two phenotypes (disease status and age; q = 2). a Data generation procedure for the observed methylation vector Oi for sample i (i = 1, …, n). In the top panel, Oi is the convolution of cell-type-specific methylation profiles ui with cellular compositions pi. Both ui and pi depend on the attributes of sample i. The bottom panel describes how sample i’s phenotypes affect ui via two phenotype-effect matrices B1 and B2. In B1 and B2, the white square represents zero, which indicates that the phenotype exerts no influence on the corresponding methylation level in ui. b Inputs and outputs of HIRE. We input the observed methylation matrix O, the phenotype data matrix X, and a predetermined cell type number K into HIRE, and HIRE outputs the estimates for the cellular compositions , the baseline methylation profiles , the phenotype effects , and the penalized BIC value. In addition, HIRE tests whether there is any association between CpG site j and phenotype in cell type k— vs —and provides the p-values
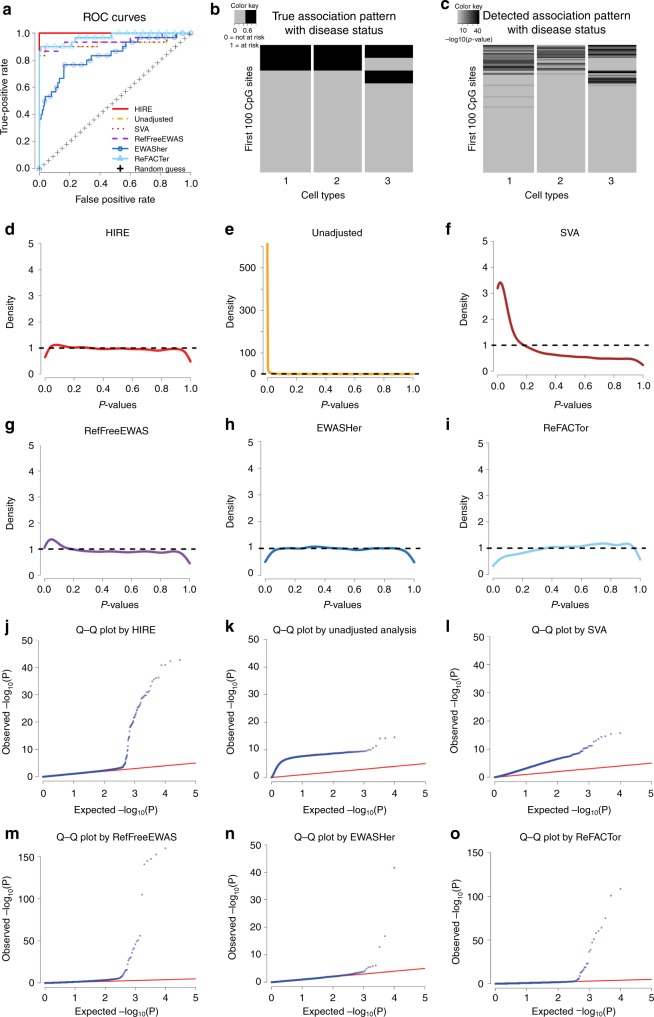
Association detection performance of HIRE and commonly used methods in the true alternative setting with K = 3 and n = 180. Source data are provided as a Source Data file. In all figures, red corresponds to HIRE; yellow indicates the unadjusted analysis; brown represents SVA; purple refers to RefFreeEWAS; dark blue indicates EWASher; and light blue corresponds to ReFACTor. a ROC curves of HIRE and commonly used methods. HIRE has the largest area under the curve among all of the methods. b True cell-type-specific association pattern with disease status for 10,000 simulated CpG sites; columns correspond to cell types, and the rows represent the CpG sites. Dark cells correspond to risk-CpG sites, and grey cells are CpG sites not associated with the disease status. c Detected cell-type-specific association pattern with disease status by HIRE. Darkness represents
d–i The p-value density plots for association with disease status in the simulation dataset for d HIRE, e unadjusted analysis, f SVA, g RefFreeEWAS, h EWASHer, and i ReFACTor. j–o The Q-Q plots for association with disease status for j HIRE, k unadjusted analysis, l SVA, m RefFreeEWAS, n EWASHer, and o ReFACTor
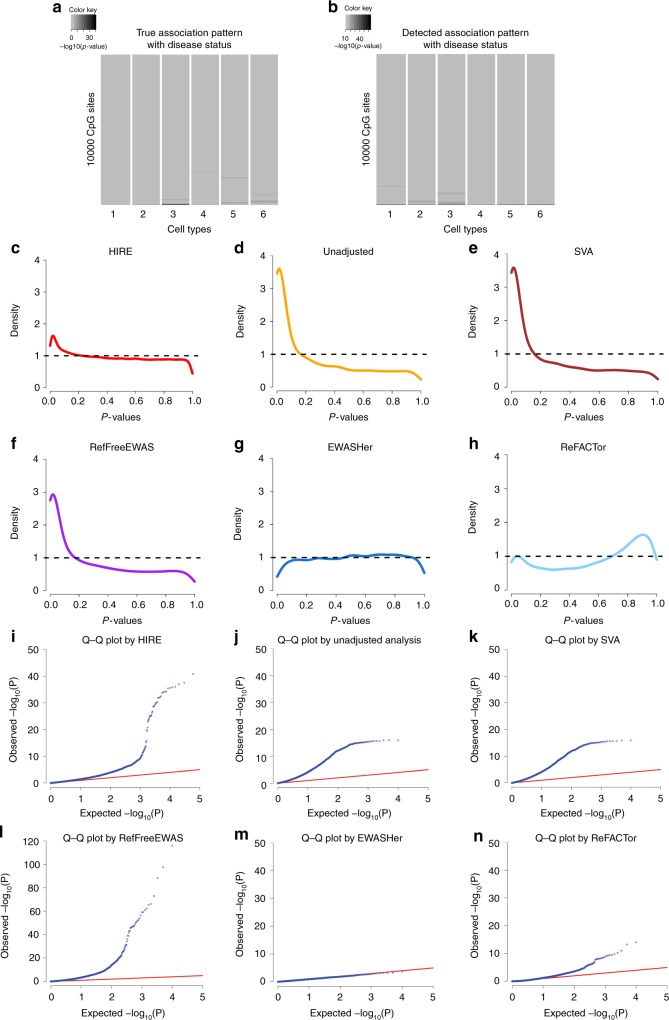
Application of HIRE and commonly used methods to two real methylation datasets: RA and GALA II. Source data are provided as a Source Data file. a Cell-type-specic association pattern with RA status detected by HIRE in the RA dataset. Darkness represents the −log10(p−value). b Cell-type-specic association pattern with gender detected by HIRE in the GALA II dataset. The darkness represents the −log10(p−value). c–h The p-value density plots for association with RA status in the RA dataset for c HIRE, d unadjusted analysis, e SVA, f RefFreeEWAS, g EWASHer, and h ReFACTor. i-n Q-Q plots for association with RA status in the RA dataset for i HIRE, j unadjusted analysis, k SVA, l RefFreeEWAS, m EWASHer, and n ReFACTor
Similar articles
-
DNA methylation in childhood asthma: an epigenome-wide meta-analysis.Lancet Respir Med. 2018 May;6(5):379-388. doi: 10.1016/S2213-2600(18)30052-3. Epub 2018 Feb 26. Lancet Respir Med. 2018. PMID: 29496485
-
Epigenome-wide association study of DNA methylation and adult asthma in the Agricultural Lung Health Study.Eur Respir J. 2020 Sep 3;56(3):2000217. doi: 10.1183/13993003.00217-2020. Print 2020 Sep. Eur Respir J. 2020. PMID: 32381493 Free PMC article.
-
Correcting for Sample Heterogeneity in Methylome-Wide Association Studies.Methods Mol Biol. 2017;1589:107-114. doi: 10.1007/7651_2015_266. Methods Mol Biol. 2017. PMID: 26246354
-
Epigenome-wide association studies in asthma: A systematic review.Clin Exp Allergy. 2019 Jul;49(7):953-968. doi: 10.1111/cea.13403. Epub 2019 May 14. Clin Exp Allergy. 2019. PMID: 31009112
-
Recommendations for the design and analysis of epigenome-wide association studies.Nat Methods. 2013 Oct;10(10):949-55. doi: 10.1038/nmeth.2632. Nat Methods. 2013. PMID: 24076989 Review.
Cited by
-
CeDAR: incorporating cell type hierarchy improves cell type-specific differential analyses in bulk omics data.Genome Biol. 2023 Feb 28;24(1):37. doi: 10.1186/s13059-023-02857-5. Genome Biol. 2023. PMID: 36855165 Free PMC article.
-
A comprehensive assessment of cell type-specific differential expression methods in bulk data.Brief Bioinform. 2023 Jan 19;24(1):bbac516. doi: 10.1093/bib/bbac516. Brief Bioinform. 2023. PMID: 36472568 Free PMC article.
-
iProMix: A mixture model for studying the function of ACE2 based on bulk proteogenomic data.J Am Stat Assoc. 2023;118(541):43-55. doi: 10.1080/01621459.2022.2110876. Epub 2022 Oct 5. J Am Stat Assoc. 2023. PMID: 37409267 Free PMC article.
-
A pan-tissue DNA methylation atlas enables in silico decomposition of human tissue methylomes at cell-type resolution.Nat Methods. 2022 Mar;19(3):296-306. doi: 10.1038/s41592-022-01412-7. Epub 2022 Mar 11. Nat Methods. 2022. PMID: 35277705 Free PMC article.
-
Cell-type-specific resolution epigenetics without the need for cell sorting or single-cell biology.Nat Commun. 2019 Jul 31;10(1):3417. doi: 10.1038/s41467-019-11052-9. Nat Commun. 2019. PMID: 31366909 Free PMC article.
References
Publication types
MeSH terms
LinkOut - more resources
Full Text Sources
