

Sticky collisions of ultracold RbCs molecules
- PMID: 31308368
- PMCID: PMC6629645
- DOI: 10.1038/s41467-019-11033-y
Sticky collisions of ultracold RbCs molecules
Abstract
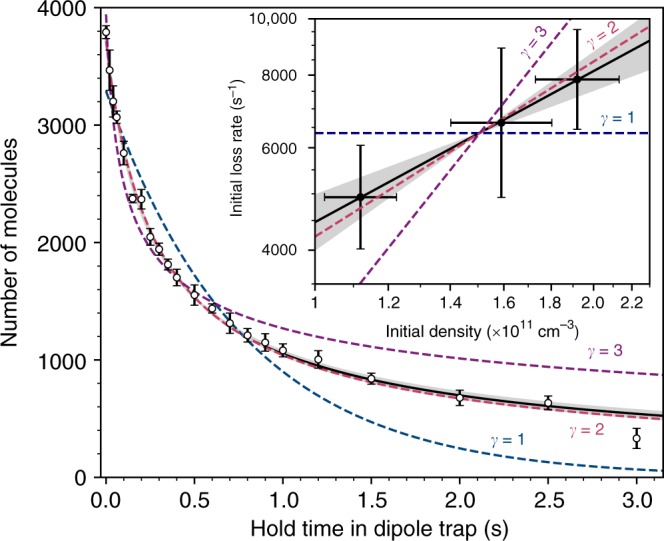
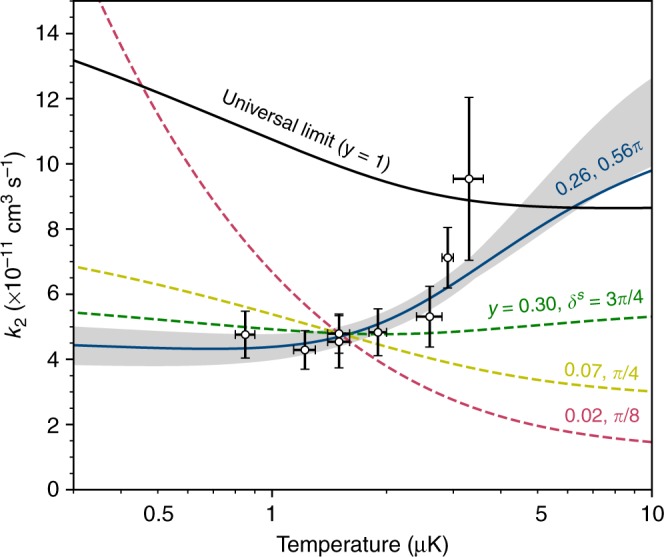
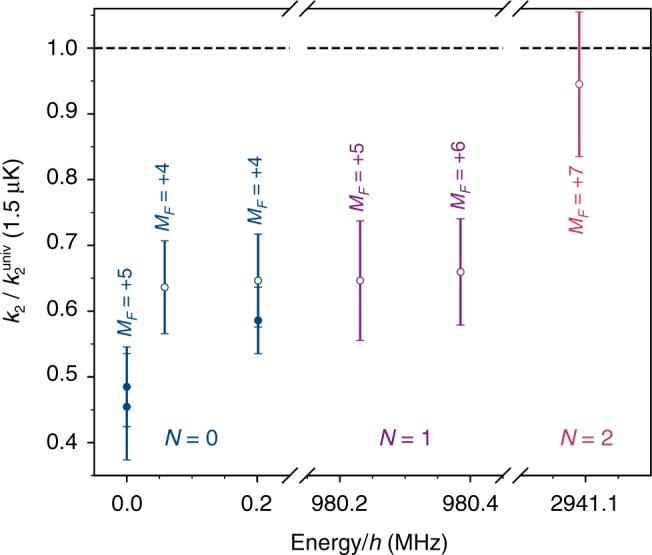
Understanding and controlling collisions is crucial to the burgeoning field of ultracold molecules. All experiments so far have observed fast loss of molecules from the trap. However, the dominant mechanism for collisional loss is not well understood when there are no allowed 2-body loss processes. Here we experimentally investigate collisional losses of nonreactive ultracold 87Rb133Cs molecules, and compare our findings with the sticky collision hypothesis that pairs of molecules form long-lived collision complexes. We demonstrate that loss of molecules occupying their rotational and hyperfine ground state is best described by second-order rate equations, consistent with the expectation for complex-mediated collisions, but that the rate is lower than the limit of universal loss. The loss is insensitive to magnetic field but increases for excited rotational states. We demonstrate that dipolar effects lead to significantly faster loss for an incoherent mixture of rotational states.
Conflict of interest statement
The authors declare no competing interests.
Figures
Similar articles
-
Ultracold Sticky Collisions: Theoretical and Experimental Status.J Phys Chem A. 2023 Jan 26;127(3):729-741. doi: 10.1021/acs.jpca.2c08095. Epub 2023 Jan 9. J Phys Chem A. 2023. PMID: 36624934 Free PMC article.
-
Loss of Ultracold ^{87}Rb^{133}Cs Molecules via Optical Excitation of Long-Lived Two-Body Collision Complexes.Phys Rev Lett. 2020 Apr 24;124(16):163402. doi: 10.1103/PhysRevLett.124.163402. Phys Rev Lett. 2020. PMID: 32383932
-
Ultracold dense samples of dipolar RbCs molecules in the rovibrational and hyperfine ground state.Phys Rev Lett. 2014 Nov 14;113(20):205301. doi: 10.1103/PhysRevLett.113.205301. Epub 2014 Nov 12. Phys Rev Lett. 2014. PMID: 25432045
-
Bimolecular Chemistry in the Ultracold Regime.Annu Rev Phys Chem. 2022 Apr 20;73:73-96. doi: 10.1146/annurev-physchem-090419-043244. Epub 2021 Dec 10. Annu Rev Phys Chem. 2022. PMID: 34890257 Review.
-
Quantum control of reactions and collisions at ultralow temperatures.Chem Soc Rev. 2022 Mar 7;51(5):1685-1701. doi: 10.1039/d1cs01040a. Chem Soc Rev. 2022. PMID: 35169822 Review.
Cited by
-
Roaming pathways and survival probability in real-time collisional dynamics of cold and controlled bialkali molecules.Sci Rep. 2021 May 19;11(1):10598. doi: 10.1038/s41598-021-90004-0. Sci Rep. 2021. PMID: 34011983 Free PMC article.
-
Observation of Bose-Einstein condensation of dipolar molecules.Nature. 2024 Jul;631(8020):289-293. doi: 10.1038/s41586-024-07492-z. Epub 2024 Jun 3. Nature. 2024. PMID: 38831053
-
Towards chemistry at absolute zero.Nat Rev Chem. 2021 Feb;5(2):125-140. doi: 10.1038/s41570-020-00239-0. Epub 2021 Jan 12. Nat Rev Chem. 2021. PMID: 37117610 Review.
-
Bose-Einstein condensation of non-ground-state caesium atoms.Nat Commun. 2024 May 3;15(1):3739. doi: 10.1038/s41467-024-47760-0. Nat Commun. 2024. PMID: 38702339 Free PMC article.
-
Long-lived multilevel coherences and spin-1 dynamics encoded in the rotational states of ultracold molecules.Nat Commun. 2025 Aug 4;16(1):7131. doi: 10.1038/s41467-025-62275-y. Nat Commun. 2025. PMID: 40759906 Free PMC article.
References
Grants and funding
- EP/H003363/1/RCUK | Engineering and Physical Sciences Research Council (EPSRC)
- EP/I012044/1/RCUK | Engineering and Physical Sciences Research Council (EPSRC)
- EP/P008275/1/RCUK | Engineering and Physical Sciences Research Council (EPSRC)
- EP/P01058X/1/RCUK | Engineering and Physical Sciences Research Council (EPSRC)
LinkOut - more resources
Full Text Sources
