

Environmentally-Controlled Near Infrared Spectroscopic Imaging of Bone Water
- PMID: 31308386
- PMCID: PMC6629628
- DOI: 10.1038/s41598-019-45897-3
Environmentally-Controlled Near Infrared Spectroscopic Imaging of Bone Water
Abstract
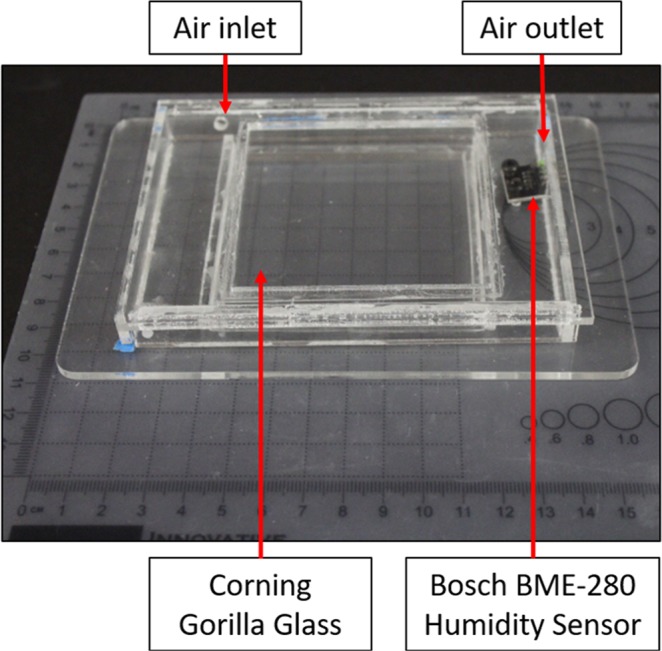
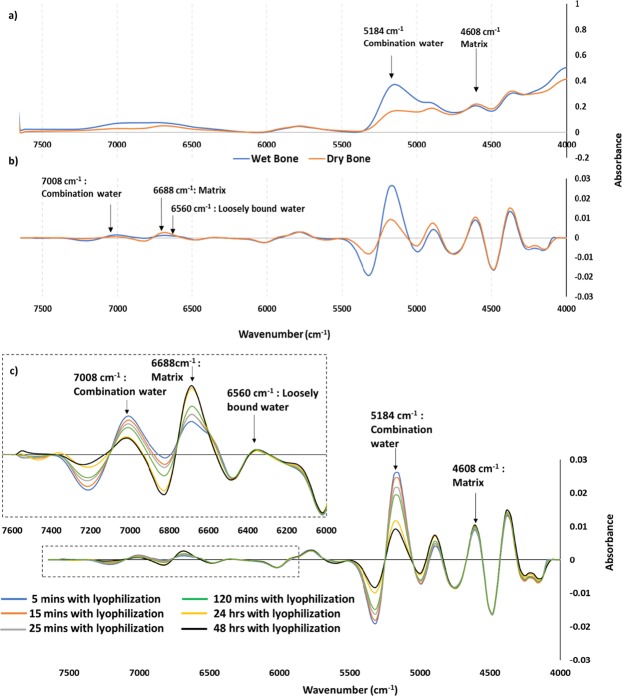
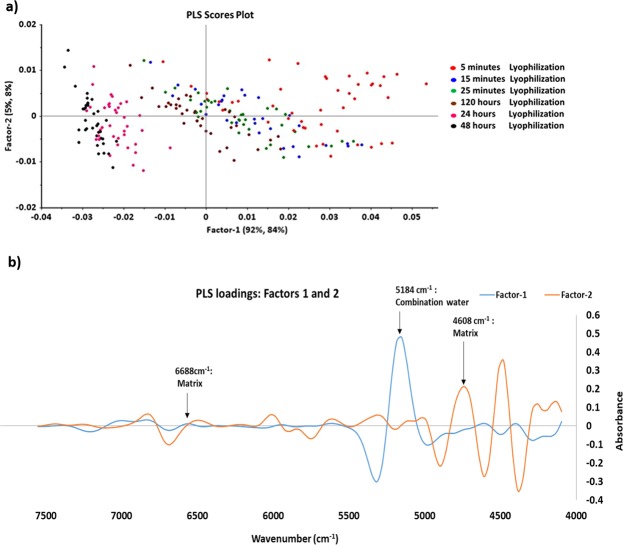
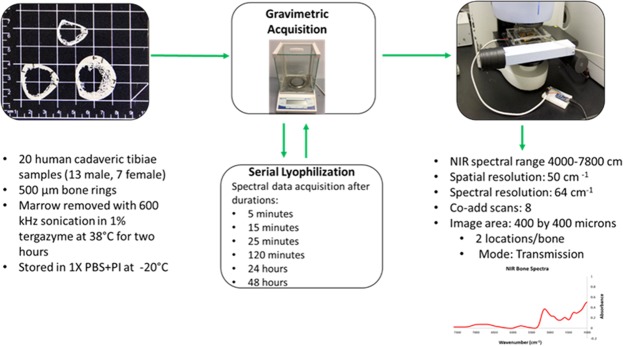
We have designed an environmentally-controlled chamber for near infrared spectroscopic imaging (NIRSI) to monitor changes in cortical bone water content, an emerging biomarker related to bone quality assessment. The chamber is required to ensure repeatable spectroscopic measurements of tissues without the influence of atmospheric moisture. A calibration curve to predict gravimetric water content from human cadaveric cortical bone was created using NIRSI data obtained at six different lyophilization time points. Partial least squares (PLS) models successfully predicted bone water content that ranged from 0-10% (R = 0.96, p < 0.05, root mean square error of prediction (RMSEP) = 7.39%), as well as in the physiologic range of 4-10% of wet tissue weight (R = 0.87, p < 0.05, RMSEP = 14.5%). Similar results were obtained with univariate and bivariate regression models for prediction of water in the 0-10% range. Further, we identified two new NIR bone absorbances, at 6560 cm-1 and 6688 cm-1, associated with water and collagen respectively. Such data will be useful in pre-clinical studies that investigate changes in bone quality with disease, aging and with therapeutic use.
Conflict of interest statement
The authors declare no competing interests.
Figures


Similar articles
-
In-line multipoint near-infrared spectroscopy for moisture content quantification during freeze-drying.Anal Chem. 2013 Feb 19;85(4):2377-84. doi: 10.1021/ac303403p. Epub 2013 Feb 4. Anal Chem. 2013. PMID: 23351045
-
Non-destructive NIR spectral imaging assessment of bone water: Comparison to MRI measurements.Bone. 2017 Oct;103:116-124. doi: 10.1016/j.bone.2017.06.015. Epub 2017 Jun 28. Bone. 2017. PMID: 28666972 Free PMC article.
-
Validation of a multipoint near-infrared spectroscopy method for in-line moisture content analysis during freeze-drying.J Pharm Biomed Anal. 2014 Jul;95:229-37. doi: 10.1016/j.jpba.2014.03.008. Epub 2014 Mar 15. J Pharm Biomed Anal. 2014. PMID: 24699368
-
Global regression model for moisture content determination using near-infrared spectroscopy.Eur J Pharm Biopharm. 2017 Oct;119:343-352. doi: 10.1016/j.ejpb.2017.07.007. Epub 2017 Jul 17. Eur J Pharm Biopharm. 2017. PMID: 28729179
-
Determining particle size and water content by near-infrared spectroscopy in the granulation of naproxen sodium.J Pharm Biomed Anal. 2018 Mar 20;151:209-218. doi: 10.1016/j.jpba.2018.01.005. Epub 2018 Jan 6. J Pharm Biomed Anal. 2018. PMID: 29353809
Cited by
-
Applications of Vibrational Spectroscopy for Analysis of Connective Tissues.Molecules. 2021 Feb 9;26(4):922. doi: 10.3390/molecules26040922. Molecules. 2021. PMID: 33572384 Free PMC article. Review.
-
Near-infrared spectroscopy for structural bone assessment.Bone Jt Open. 2023 Apr 7;4(4):250-261. doi: 10.1302/2633-1462.44.BJO-2023-0014.R1. Bone Jt Open. 2023. PMID: 37051828 Free PMC article.
-
Characterization of connective tissues using near-infrared spectroscopy and imaging.Nat Protoc. 2021 Feb;16(2):1297-1329. doi: 10.1038/s41596-020-00468-z. Epub 2021 Jan 18. Nat Protoc. 2021. PMID: 33462441
-
Near infrared spectroscopic assessment of loosely and tightly bound cortical bone water.Analyst. 2020 May 21;145(10):3713-3724. doi: 10.1039/c9an02491c. Epub 2020 Apr 28. Analyst. 2020. PMID: 32342066 Free PMC article.
-
Approaches for In Situ Monitoring of Matrix Development in Hydrogel-Based Engineered Cartilage.Tissue Eng Part C Methods. 2020 Apr;26(4):225-238. doi: 10.1089/ten.TEC.2020.0014. Epub 2020 Apr 3. Tissue Eng Part C Methods. 2020. PMID: 32131710 Free PMC article.
References
Publication types
MeSH terms
Substances
Grants and funding
LinkOut - more resources
Full Text Sources
Miscellaneous
