. 2019 Jul 15;9(1):10165.
doi: 10.1038/s41598-019-46462-8.

HLA class II-Restricted CD8+ T cells in HIV-1 Virus Controllers

Affiliations

HLA class II-Restricted CD8+ T cells in HIV-1 Virus Controllers

Tinashe E Nyanhete et al. Sci Rep. .

Abstract

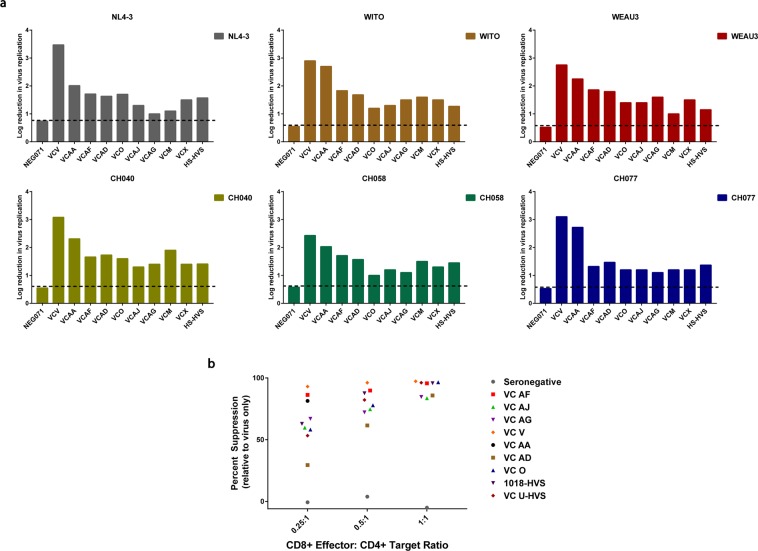
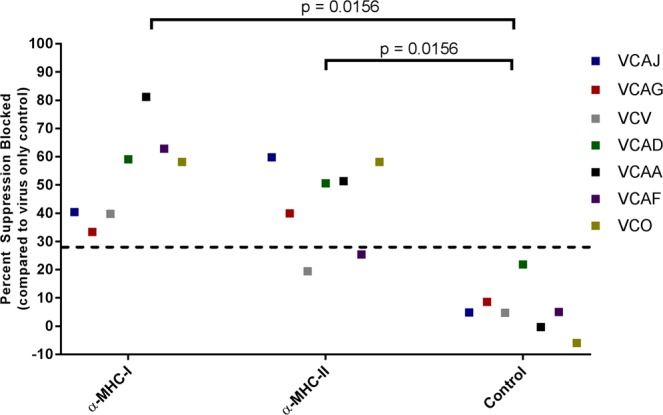
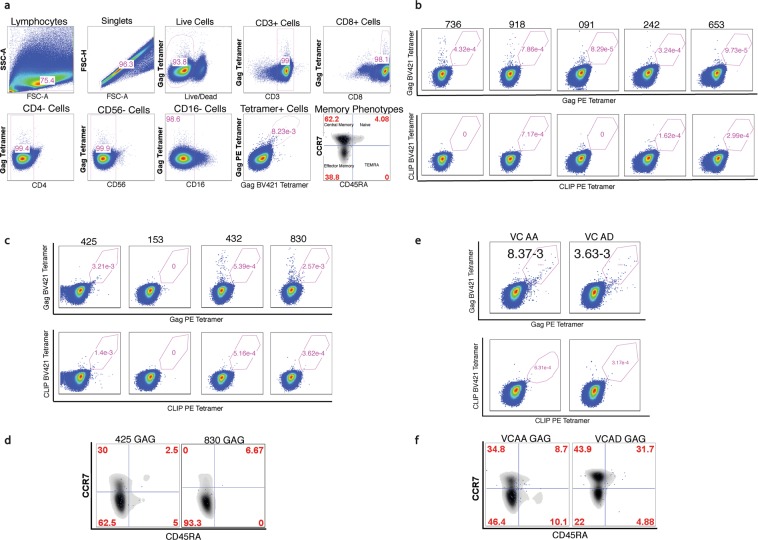
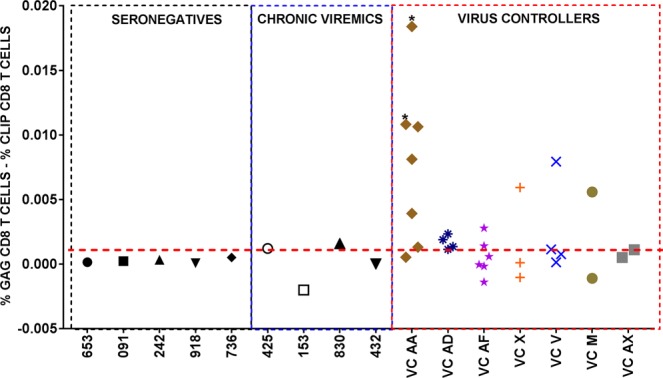
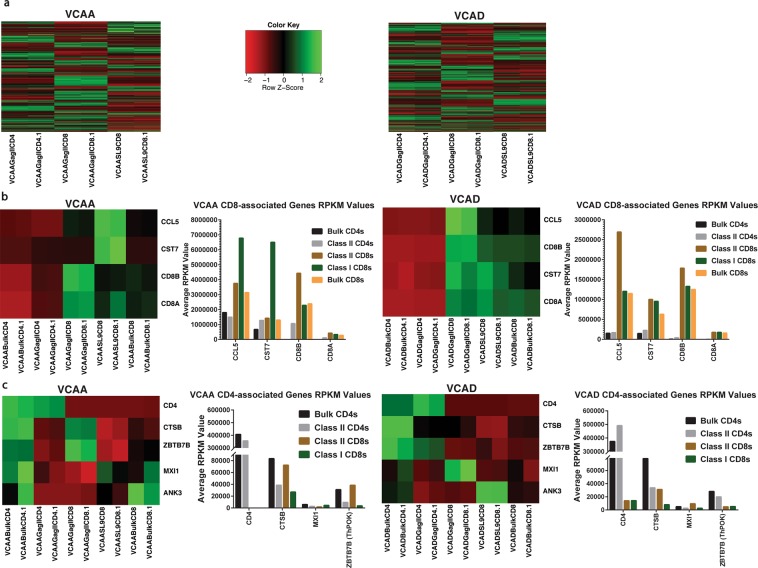
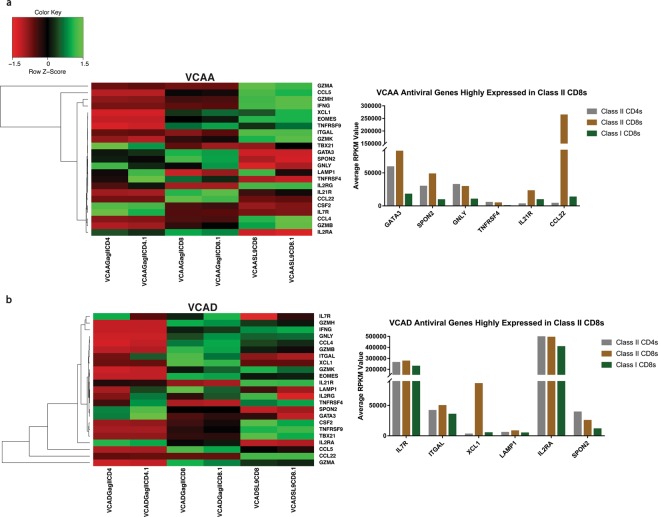
A paradigm shifting study demonstrated that induction of MHC class E and II-restricted CD8+ T cells was associated with the clearance of SIV infection in rhesus macaques. Another recent study highlighted the presence of HIV-1-specific class II-restricted CD8+ T cells in HIV-1 patients who naturally control infection (virus controllers; VCs). However, questions regarding class II-restricted CD8+ T cells ontogeny, distribution across different HIV-1 disease states and their role in viral control remain unclear. In this study, we investigated the distribution and anti-viral properties of HLA-DRB1*0701 and DQB1*0501 class II-restricted CD8+ T cells in different HIV-1 patient cohorts; and whether class II-restricted CD8+ T cells represent a unique T cell subset. We show that memory class II-restricted CD8+ T cell responses were more often detectable in VCs than in chronically infected patients, but not in healthy seronegative donors. We also demonstrate that VC CD8+ T cells inhibit virus replication in both a class I- and class II-dependent manner, and that in two VC patients the class II-restricted CD8+ T cells with an anti-viral gene signature expressed both CD4+ and CD8+ T cell lineage-specific genes. These data demonstrated that anti-viral memory class II-restricted CD8+ T cells with hybrid CD4+ and CD8+ features are present during natural HIV-1 infection.


Conflict of interest statement

The authors declare no competing interests.

Figures

Figure 1
Figure 1
(A). HIV-1 VC CD8+ T cells suppress replication of multiple clade B viruses. CD8+ T cells isolated from nine VC patients, one VC CD8+ T cell line (HS-HVS) and one seronegative donor (NEG071) were tested for antiviral activity against a panel of clade B lab-adapted and T/F viruses in the CD8 VIA. Autologous CD8 and CD4 T cells were co-cultured together in duplicate at 4 different Effector:Target ratios (0.25:1, 0.5:1, 1:1 and 2:1), with the highest Effector:Target ratio (2:1) shown. Virus suppression is expressed as a log reduction in virus replication in the presence of CD8+ T cells compared to target cell only control at the 2:1 Effector:Target ratio. The dotted black horizontal line is the cut-off for positive log reduction in virus replication and is determined using the NEG071 negative control. VC O and VC AF were run on 2 separate days to confirm reproducibility of the assay. (B) Dose dependent CD8+ T cell inhibition of clade B matched T/F infectious molecular clone CH058.c. CD8+ T cells isolated from seven VC patients, two VC CD8+ T cell lines (VCU-HVS and 1018-HVS) and one seronegative donor were tested for antiviral activity against the T/F virus CH058.c in the CD8 VIA. Autologous CD8 and CD4 T cells were co-cultured together at 0.25:1; 0.5:1; and 1:1 Effector:Target ratios. Percent suppression on the y-axis represents virus replication suppression as a percentage using changes in relative light units (RLU) from wells containing CD8+ T cells compared with control wells with virus only (lacking CD8+ T cells). Each VC was considered as a biological replicate due to limited availability of these rare patient samples. VCAA displayed high levels of viral replication suppression in infected target autologous CD4+ T cells at the lowest ratio tested (0.25:1) so no further testing was done at higher ratios (0.5:1 and 1:1) due to limited VCAA sample availability.
Figure 2
Figure 2
HIV-1 VC HLA Class I and HLA Class II-restricted CD8+ T cell-mediated inhibition of T/F virus replication in autologous CD4+ T cells. Autologous CD8+ T cells isolated from seven VCs were tested for blocking of CD8 antiviral activity by monoclonal antibodies to MHC molecules. 5 µg/ml of the MHC blocking antibodies was used to block the MHC molecules before the infected CD4+ T cells were co-cultured with the CD8+ T cells. The CD8+ T cells were co-cultured with the infected autologous CD4+ T cell targets at a range of Effector:Target ratios of 0.25:1, 0.5:1 and 1:1, with results for the 0.25:1 co-culture ratio shown in the figure. The capacity of each monoclonal antibody to block CD8+ T cell mediated antiviral activity is represented as percent CH058.c virus replication suppression blocked in autologous CD4+ T cells in the presence of either the anti-MHC mAb or an isotype negative control Ab. The cutoff for positive percent suppression blocked is 28.0% (calculated as the Mean+ (3× standard deviation)). Sign test (p-value < 0.05) provided evidence of a statistically significant difference in the paired response between MHC-I or MHC-II and negative control in the blocking assays. Assay reproducibility was confirmed by 2 independent operators who both assayed VC AF and VC AJ, while VC V and VC O were run on 2 separate days by the same operator to further confirm assay reproducibility.
Figure 3
Figure 3
(A). Gating strategy for flow cytometry analysis of tetramer-positive HLA DRB1-restricted Gag-specific CD8+ T cells in HIV-1 in our patient cohorts. Cells were first gated for lymphocytes (SSC-A vs. FSC-A) and singlets (FSC-H vs. FSC-A). The single cell lymphocytes were then stained with Live/Dead Aqua stain to isolate the live cells. The live cells were further analyzed for expression of CD3 and CD8 while gating out CD4+ cells, CD56+ and CD16+ cells (Natural Killer cells) so as to narrow down the target population to live, healthy CD8+ T cells (CD3+, CD8+, CD4−, CD56−, CD16−). Gag or CLIP tetramer positive cells were then analyzed from the pure CD8+ T cell fraction by double fluorochrome verification (PE and BV421) to ensure discrimination of true tetramer binding events. Only events that were double positive for the PE and BV421 tetramers were considered to be the tetramer positive events. The memory phenotypes of the tetramer positive events were defined by the surface expression of CCR7 and CD45RA. Naïve tetramer positive events were double positive for CCR7 and CD45RA. Central Memory tetramer positive events were CCR7+ and CD45RA-. Effector Memory tetramer positive events were CCR7- and CD45RA-. Terminally differentiated effector memory (TEMRA) tetramer positive events were CCR7- and CD45RA+ . (B) Gag-specific HLA DRB1*0701 restricted CD8+ T cells are absent in HLA-matched seronegative healthy individuals. Anti-CD3/CD28 activated PBMCs were enriched for CD8+ T cells by negative selection after seven days in culture and subsequently stained with PE and BV421-labeled Gag293-312 tetramers and analyzed by flow cytometry. The human CLIP87-101 –DRB1 tetramer served as the negative control. Results are presented as a percentage of the CD8+ T cells in the PBMC pool. DRB1-restricted HIV-1 Gag293-312 –reactive CD8+ T cells are absent in activated PBMCs from healthy donors. (C) Gag-specific HLA DRB1*0701 restricted CD8+ T cells are rarely detectable in HLA-matched HIV-1 Chronic patients. Anti-CD3/CD28 activated PBMCs were enriched for CD8+ T cells by negative selection after seven days in culture and subsequently stained with PE and BV421-labeled Gag293-312 tetramers and analyzed by flow cytometry. The human CLIP87-101 –DRB1 tetramer served as the negative control. Results are presented as a percentage of the CD8+ T cells in the PBMC pool. DRB1-restricted HIV-1 Gag293-312 –reactive CD8+ T cells are barely detectable in activated PBMCs from HIV-1+ Chronic patients. (D) The majority of DRB1-restricted Gag293-312 specific CD8+ T cells reside in the effector memory (CCR7CD45RA) subsets in PBMC in the HIV-1+ Chronic patients. DRB1-restricted Gag293-312 specific CD8+ T cells from chronic patients 425 and 830 (2 chronic patients with barely detectable DRB1-restricted Gag293-312 specific CD8+ T cells) were separated into four subsets (Naïve, Central Memory, Effector Memory and Terminally-differentiated Effector Memory) based on CD45RA and CCR7 surface expression levels. (E) Gag293-312 tetramer detection of Gag293-312 -specific HLA-DRB1-restricted CD8+ T cells in VCAA and VCAD. Anti-CD3/CD28 activated PBMCs were enriched for CD8+ T cells by negative selection after seven days in culture and subsequently stained with PE and BV421-labeled Gag293-312 tetramers and analyzed by flow cytometry. The human CLIP87-101 –DRB1 tetramer served as the negative control. Results are presented as a percentage of the CD8+ T cells in the PBMC pool. DRB1-restricted HIV-1 Gag293-312 –reactive CD8+ T cells can be readily detected in activated PBMCs from anHIV-1virus controller individuals. (F) The majority of the DRB1-restricted Gag293-312 specific CD8+ T cells in VC AA and AD reside in the effector memory (CCR7CD45RA) and central memory (CCR7+CD45RA) subsets in PBMCs. DRB1-restricted Gag293-312 specific CD8+ T cells from VC AA and VC AD were separated into four subsets (Naïve, Central Memory, Effector Memory and Terminally-differentiated Effectors) based on CD45RA and CCR7 surface expression levels.
Figure 4
Figure 4
Gag-specific HLA DRB1*0701 restricted CD8+ T cells are present in multiple VC patients at different draw dates. PBMCs obtained from VC patients at different draw dates were screened for the presence of Gag-specific HLA class II-restricted CD8+ T cells using tetramer staining. The frequency of CLIP+ CD8+ T cells was subtracted from the frequency of Gag+ CD8+ T cells so as to get a positive signal detection of Gag specific CD8+ T cells. The positivity cut-off, shown as the red horizontal line, was set at 0.001% which was double the highest frequency of the HIV-1 seronegative donors. Of the seven VCs we assayed, six had detectable Gag-specific class II-restricted CD8+ T cells on at least one draw date while only VCs AA, AD and AF had detectable class II-restricted CD8+ T cells at more than one draw date. VC AA and VC AD had the most detectable class II-restricted CD8+ T cells on most of the draw dates we tested. Two of the four patients enrolled into the study as chronic patients, had detectable class II-restricted CD8+ T cells. The frequency of the Gag-specific class II-restricted CD8+ T cells observed in the chronic patients was much lower than the frequency observed in the VC patient cohort. Notably, no class II-restricted CD8+ T cell were detected in all our five HLA-matched seronegative donors. Single time points were assayed for the chronics and seronegative donors due to limited longitudinal sample availability. *Two draw dates when the patient VCAA was on ART.
Figure 5
Figure 5
(A). Gag-specific HLA DRB1*0701 restricted CD8+ T cells have a unique gene expression profile. Heatmap and hierarchical clustering of significant differentially expressed genes in tetramer sorted Gag-specific class II-restricted CD4+ T cells (GagIICD4), class II-restricted CD8+ T cells (GagIICD8), and class I-restricted CD8+ T cells (SL9CD8) from VCAA (5100 genes) and VCAD (4886 genes). Two replicates are shown for each subset. Green represents high expression, while red represents low expression. (B) Gag-specific HLA DRB1*0701 restricted CD8+ T cells express CD8+ T cell lineage-specific genes. Heatmap comparing gene expression levels of CD8+ T cell lineage specific genes CCL5, CST7, CD8A and CD8B in bulk sorted CD4+ T cells (BulkCD4), tetramer sorted Gag-specific class II-restricted CD4+ T cells (GagIICD4), class II-restricted CD8+ T cells (GagIICD8), class I-restricted CD8+ T cells (SL9CD8) and bulk sorted CD8+ T cells (BulkCD8) from VCAA and VCAD. Two replicates are shown for each subset. Green represents high expression, while red represents low expression. The bar plot shows the average reads per kilobase million (RPKM) values of the target genes. (C) Gag-specific HLA DRB1*0701 restricted CD8+ T cells express CD4+ T cell lineage-specific genes. Heatmap comparing gene expression levels of CD4+ T cell lineage specific genes CD4, CTSB (Cathepsin B), ZBTB7B (ThPOK), MXI1 and ANK3 in bulk sorted CD4+ T cells (BulkCD4), tetramer sorted Gag-specific class II-restricted CD4+ T cells (GagIICD4), class II-restricted CD8+ T cells (GagIICD8), class I-restricted CD8+ T cells (SL9CD8) and bulk sorted CD8+ T cells (BulkCD8) from VCAA and VCAD. 2 replicates are shown for each subset. Green represents high expression, while red represents low expression. The bar plot shows the average reads per kilobase million (RPKM) values of the target genes.
Figure 6
Figure 6
Gag-specific HLA DRB1*0701 restricted CD8+ T cells have a unique anti-viral gene expression profile. Heatmap and hierarchical clustering of anti-viral genes (Table 5) based on expression levels in tetramer sorted Gag-specific class II-restricted CD4+ T cells (GagIICD4), class II-restricted CD8+ T cells (GagIICD8) and class I-restricted CD8+ T cells (SL9CD8) from VCAA (A) and VCAD (B). Two replicates are shown for each subset. Green represents high expression, while red represents low expression. The bar plot shows the average reads per kilobase million (RPKM) values of anti-viral genes of interest highly expressed in class II-restricted CD8+ T cells compared to class I-restricted CD8+ T cells.
Figure 7
Figure 7
Gag-specific HLA DRB1*0701 restricted CD8+ T cells exhibit a less exhausted expression profile compared to Gag-specific HLA-A*0201 restricted CD8+ T cells. Heatmap and hierarchical clustering of selected T cell exhaustion/activation-related genes (Table 6) based on expression levels in tetramer sorted Gag-specific class II-restricted CD4+ T cells (GagIICD4), class II-restricted CD8+ T cells (GagIICD8) and class I-restricted CD8+ T cells (SL9CD8) from VCAA (A) and VCAD (B). Two replicates are shown for each subset. Green represents high expression, while red represents low expression.
Figure 8
Figure 8
(A). TCR repertoire diversity of Gag-specific HLA DRB1*0701 restricted CD4+ T cells, CD8+ T cells and HLA-A*0201 restricted CD8+ T cells in VCAA and VCAD. Top proportions bar plot showing the proportions of the top 100 most abundant clonotypes in repertoires from tetramer sorted Gag-specific class II-restricted CD4+ T cells (GagIICD4), class II-restricted CD8+ T cells (GagIICD8) and class I-restricted CD8+ T cells (SL9CD8) from VCAA and VCAD. The GINI Index calculated by tCR is listed in parentheses below each bar. (B) Tetramer sorted Gag-specific HLA DRB1*0701 restricted CD4+ T cells and CD8+ T cells targeting the same epitope have distinct TCR repertoires. Heatmap showing the Jaccard Index evaluating relatedness of TCR repertoires from tetramer sorted Gag-specific class II-restricted CD4+ T cells (GagIICD4), class II-restricted CD8+ T cells (GagIICD8) and class I-restricted CD8+ T cells (SL9CD8) using the TRBV CDR3 nucleotide sequence overlap. The Jaccard Index ranges from 0 (dissimilar) to 1 (similar).

Similar articles

Cited by

References

    1. UNAIDS. FACT SHEET NOVEMBER 2016, http://www.unaids.org/en/resources/fact-sheet (2016).
    1. Murray AJ, Kwon KJ, Farber DL, Siliciano RF. The Latent Reservoir for HIV-1: How Immunologic Memory and Clonal Expansion Contribute to HIV-1 Persistence. Journal of immunology (Baltimore, Md.: 1950) 2016;197:407–417. doi: 10.4049/jimmunol.1600343. - DOI - PMC - PubMed
    1. Nabel GJ. HIV vaccine strategies. Vaccine. 2002;20:1945–1947. doi: 10.1016/s0264-410x(02)00074-9. - DOI - PubMed
    1. Tay MZ, et al. Antibody-Mediated Internalization of Infectious HIV-1 Virions Differs among Antibody Isotypes and Subclasses. PLoS pathogens. 2016;12:e1005817. doi: 10.1371/journal.ppat.1005817. - DOI - PMC - PubMed
    1. Tomaras GD, Haynes BF. Advancing Toward HIV-1 Vaccine Efficacy through the Intersections of Immune Correlates. Vaccines (Basel) 2014;2:15–35. doi: 10.3390/vaccines2010015. - DOI - PMC - PubMed

Publication types

MeSH terms