

Acute LPS sensitization and continuous infusion exacerbates hypoxic brain injury in a piglet model of neonatal encephalopathy
- PMID: 31308390
- PMCID: PMC6629658
- DOI: 10.1038/s41598-019-46488-y
Acute LPS sensitization and continuous infusion exacerbates hypoxic brain injury in a piglet model of neonatal encephalopathy
Abstract
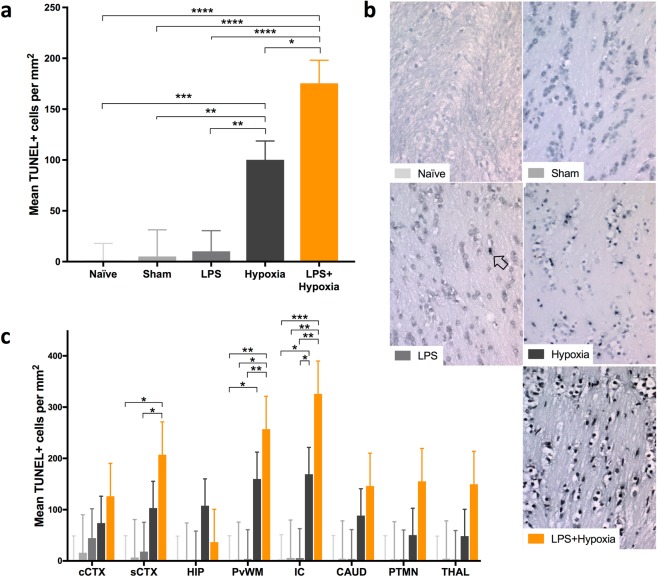
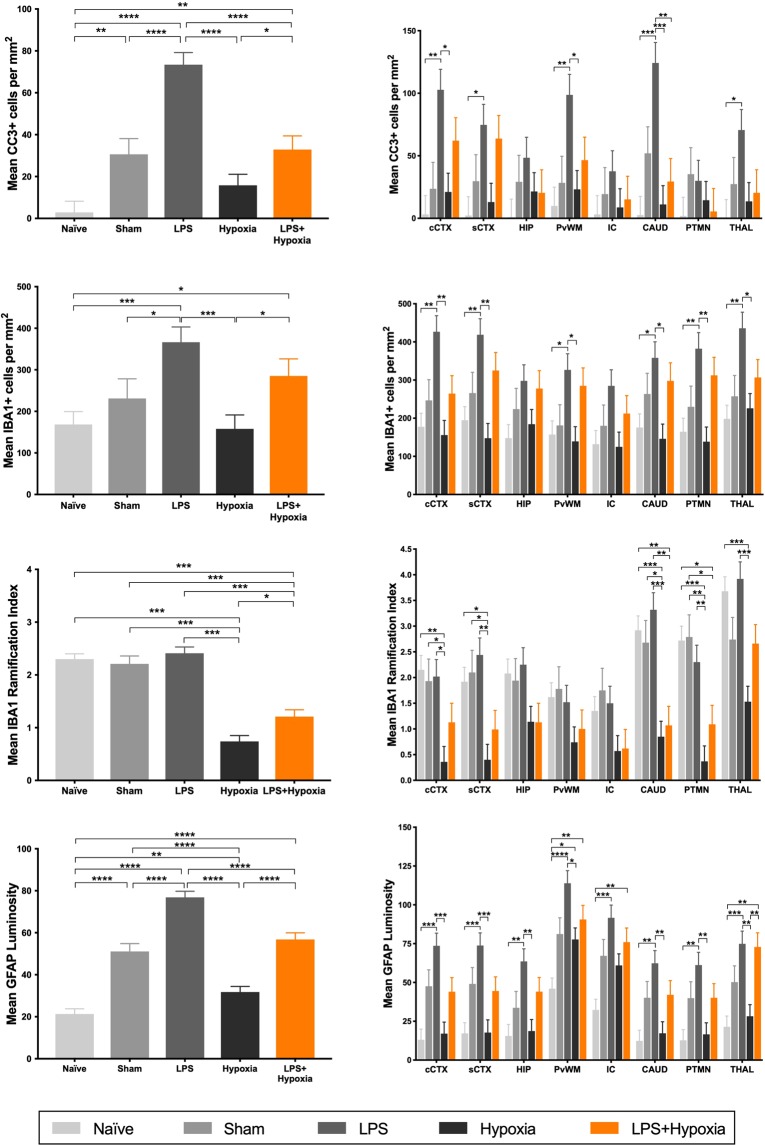
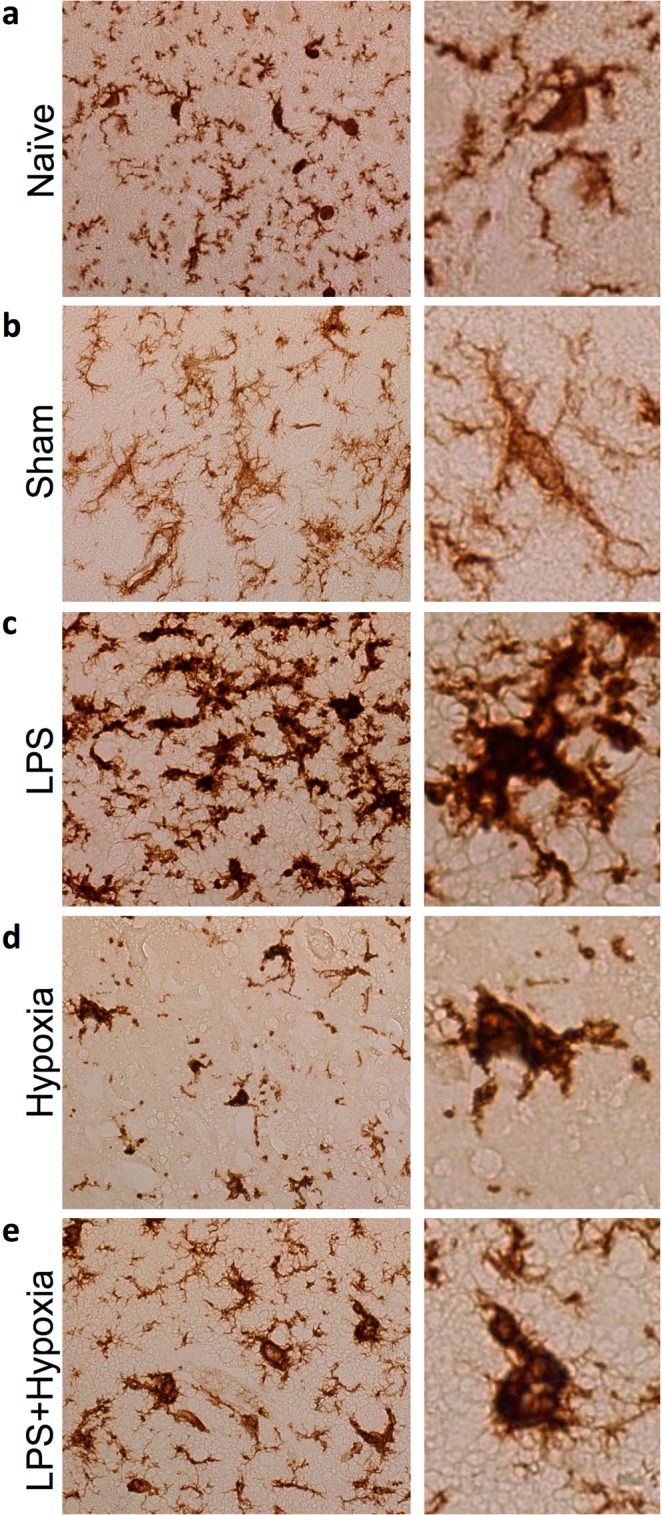
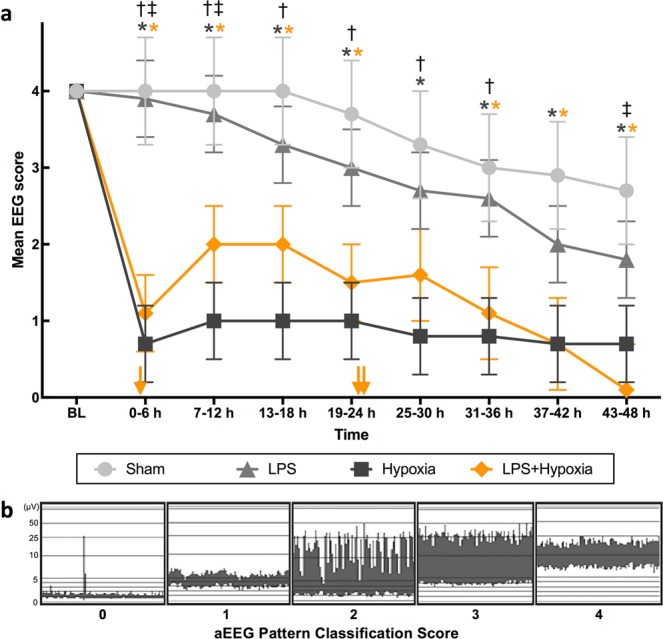
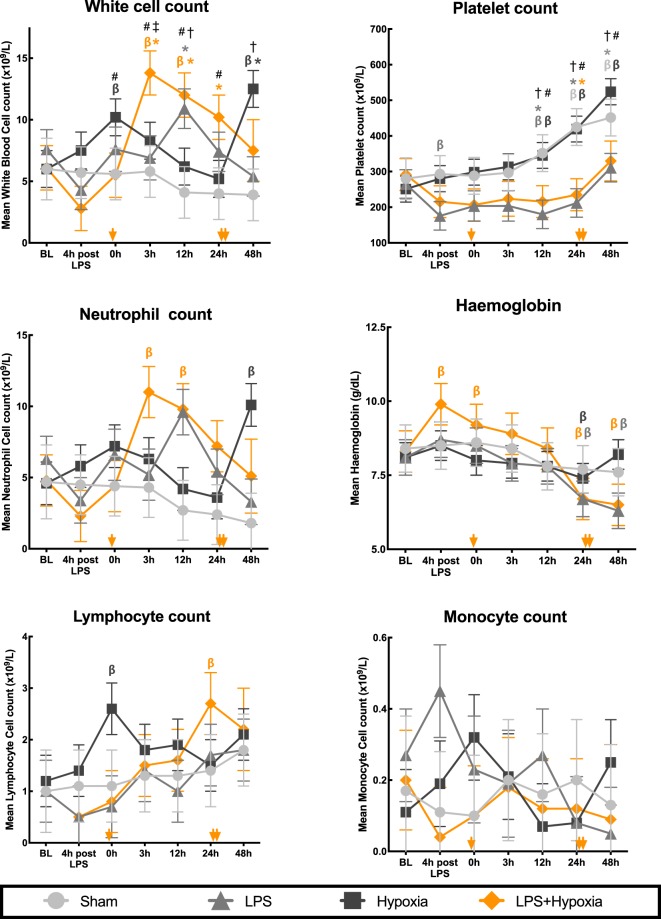
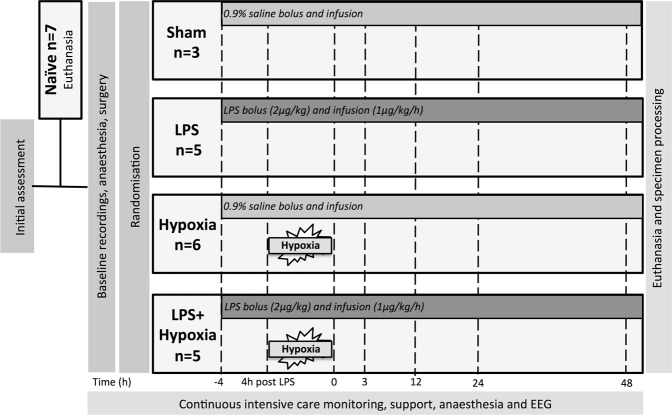
Co-existing infection/inflammation and birth asphyxia potentiate the risk of developing neonatal encephalopathy (NE) and adverse outcome. In a newborn piglet model we assessed the effect of E. coli lipopolysaccharide (LPS) infusion started 4 h prior to and continued for 48 h after hypoxia on brain cell death and systemic haematological changes compared to LPS and hypoxia alone. LPS sensitized hypoxia resulted in an increase in mortality and in brain cell death (TUNEL positive cells) throughout the whole brain, and in the internal capsule, periventricular white matter and sensorimotor cortex. LPS alone did not increase brain cell death at 48 h, despite evidence of neuroinflammation, including the greatest increases in microglial proliferation, reactive astrocytosis and cleavage of caspase-3. LPS exposure caused splenic hypertrophy and platelet count suppression. The combination of LPS and hypoxia resulted in the highest and most sustained systemic white cell count increase. These findings highlight the significant contribution of acute inflammation sensitization prior to an asphyxial insult on NE illness severity.
Conflict of interest statement
The authors declare no competing interests.
Figures
Similar articles
-
Hypothermia is not therapeutic in a neonatal piglet model of inflammation-sensitized hypoxia-ischemia.Pediatr Res. 2022 May;91(6):1416-1427. doi: 10.1038/s41390-021-01584-6. Epub 2021 May 28. Pediatr Res. 2022. PMID: 34050269 Free PMC article. Clinical Trial.
-
Serial blood cytokine and chemokine mRNA and microRNA over 48 h are insult specific in a piglet model of inflammation-sensitized hypoxia-ischaemia.Pediatr Res. 2021 Feb;89(3):464-475. doi: 10.1038/s41390-020-0986-3. Epub 2020 Jun 10. Pediatr Res. 2021. PMID: 32521540
-
Melatonin augments hypothermic neuroprotection in a perinatal asphyxia model.Brain. 2013 Jan;136(Pt 1):90-105. doi: 10.1093/brain/aws285. Epub 2012 Nov 26. Brain. 2013. PMID: 23183236
-
The role of glutamate receptor maturation in perinatal seizures and brain injury.Int J Dev Neurosci. 2002 Jun-Aug;20(3-5):339-47. doi: 10.1016/s0736-5748(02)00012-6. Int J Dev Neurosci. 2002. PMID: 12175872 Review.
-
Animal models for neonatal brain injury induced by hypoxic ischemic conditions in rodents.Exp Neurol. 2020 Dec;334:113457. doi: 10.1016/j.expneurol.2020.113457. Epub 2020 Sep 2. Exp Neurol. 2020. PMID: 32889009 Review.
Cited by
-
Microglia-Mediated Neurodegeneration in Perinatal Brain Injuries.Biomolecules. 2021 Jan 13;11(1):99. doi: 10.3390/biom11010099. Biomolecules. 2021. PMID: 33451166 Free PMC article. Review.
-
Dysregulated Monocyte and Neutrophil Functional Phenotype in Infants With Neonatal Encephalopathy Requiring Therapeutic Hypothermia.Front Pediatr. 2021 Feb 15;8:598724. doi: 10.3389/fped.2020.598724. eCollection 2020. Front Pediatr. 2021. PMID: 33659224 Free PMC article.
-
NAC and Vitamin D Restore CNS Glutathione in Endotoxin-Sensitized Neonatal Hypoxic-Ischemic Rats.Antioxidants (Basel). 2021 Mar 20;10(3):489. doi: 10.3390/antiox10030489. Antioxidants (Basel). 2021. PMID: 33804757 Free PMC article.
-
Temporal Characterization of Microglia-Associated Pro- and Anti-Inflammatory Genes in a Neonatal Inflammation-Sensitized Hypoxic-Ischemic Brain Injury Model.Oxid Med Cell Longev. 2022 Mar 2;2022:2479626. doi: 10.1155/2022/2479626. eCollection 2022. Oxid Med Cell Longev. 2022. PMID: 35281473 Free PMC article.
-
Neurological Outcome Following Newborn Encephalopathy With and Without Perinatal Infection: A Systematic Review.Front Pediatr. 2021 Dec 20;9:787804. doi: 10.3389/fped.2021.787804. eCollection 2021. Front Pediatr. 2021. PMID: 34988041 Free PMC article.
References
Publication types
MeSH terms
Substances
Grants and funding
LinkOut - more resources
Full Text Sources
Medical
Research Materials
