. 2019 Jul 15;9(1):10245.
doi: 10.1038/s41598-019-46526-9.

Perturbation of ubiquitin homeostasis promotes macrophage oxidative defenses

Affiliations

Perturbation of ubiquitin homeostasis promotes macrophage oxidative defenses

Marie-Eve Charbonneau et al. Sci Rep. .

Abstract

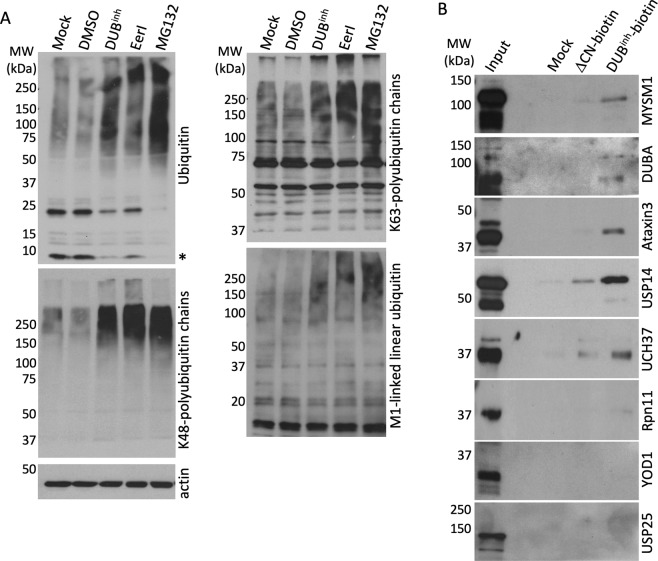
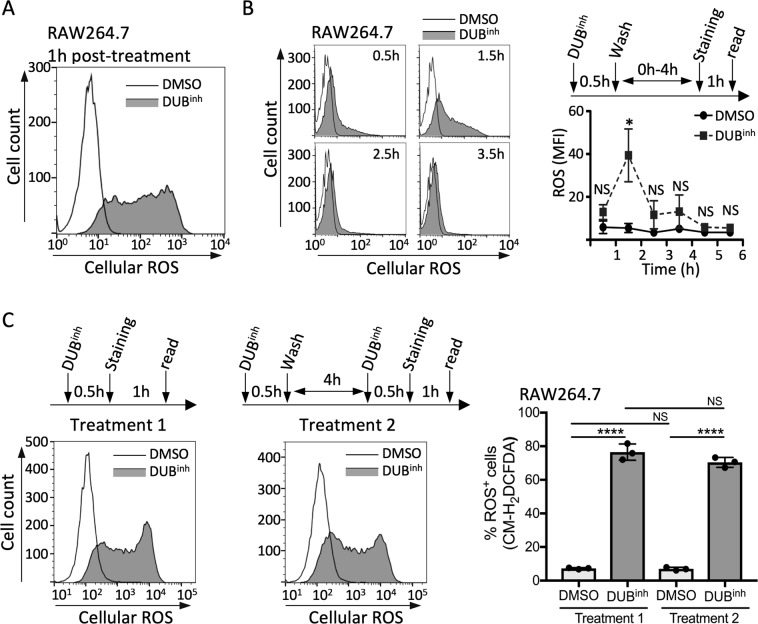
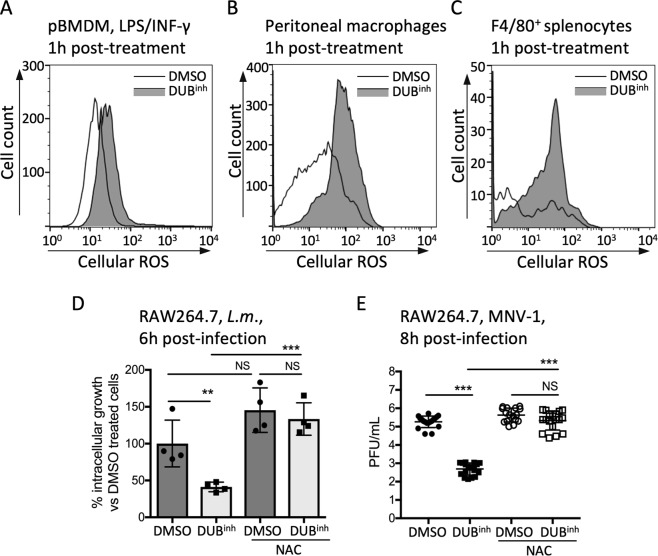
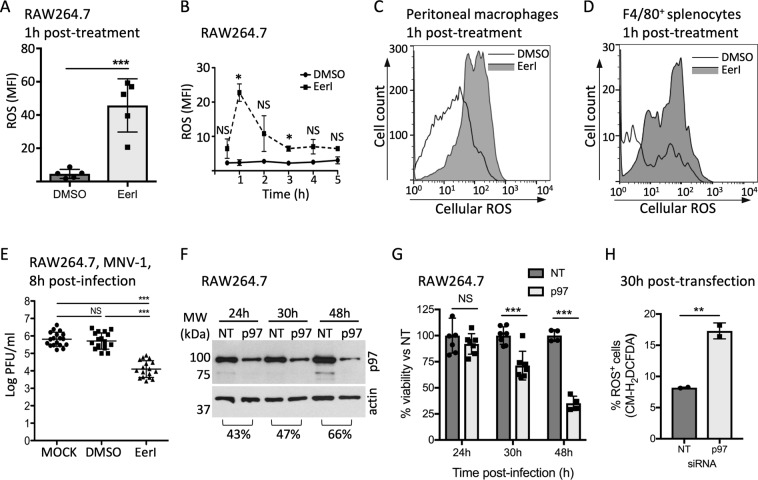
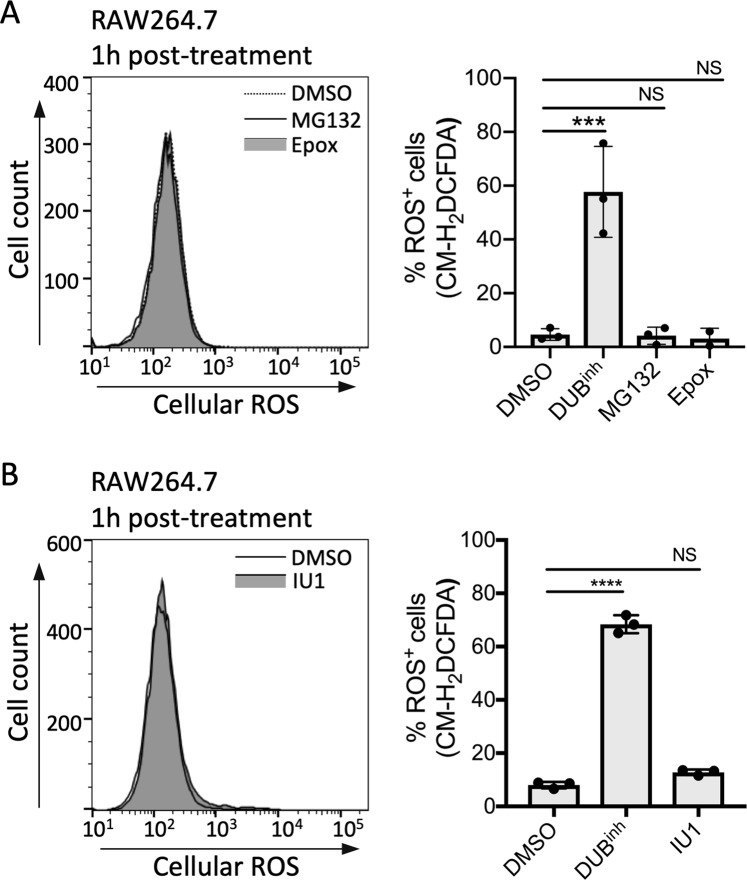
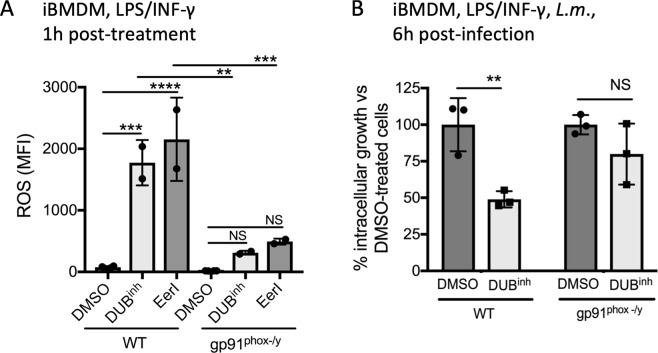
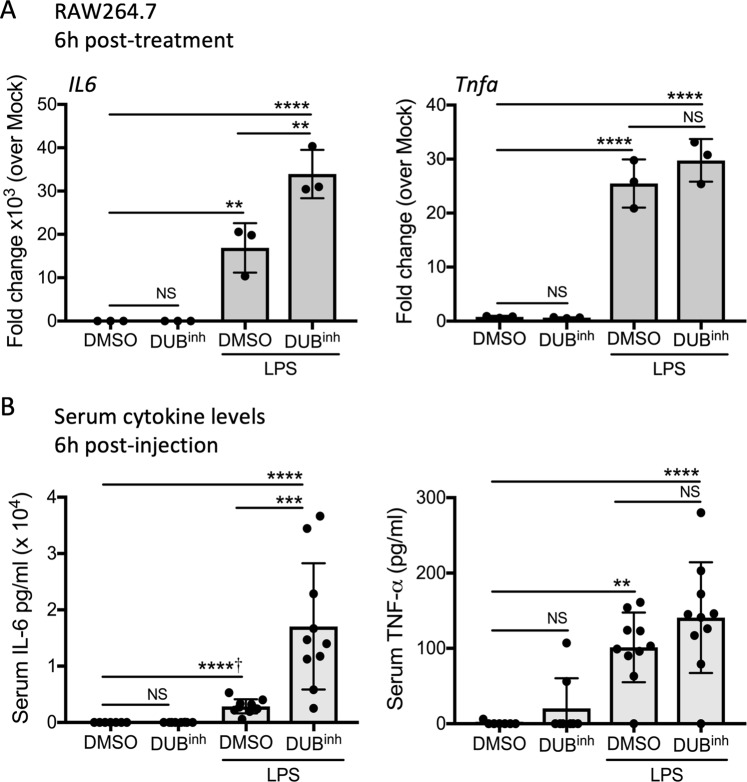
The innate immune system senses microbial ligands through pattern recognition and triggers downstream signaling cascades to promote inflammation and immune defense mechanisms. Emerging evidence suggests that cells also recognize alterations in host processes induced by infection as triggers. Protein ubiquitination and deubiquitination are post-translational modification processes essential for signaling and maintenance of cellular homeostasis, and infections can cause global alterations in the host ubiquitin proteome. Here we used a chemical biology approach to perturb the cellular ubiquitin proteome as a simplified model to study the impact of ubiquitin homeostasis alteration on macrophage function. Perturbation of ubiquitin homeostasis led to a rapid and transient burst of reactive oxygen species (ROS) that promoted macrophage inflammatory and anti-infective capacity. Moreover, we found that ROS production was dependent on the NOX2 phagocyte NADPH oxidase. Global alteration of the ubiquitin proteome also enhanced proinflammatory cytokine production in mice stimulated with a sub-lethal dose of LPS. Collectively, our findings suggest that major changes in the host ubiquitin landscape may be a potent signal to rapidly deploy innate immune defenses.


Conflict of interest statement

The authors declare no competing interests.

Figures

Figure 1
Figure 1
Perturbation of the ubiquitin proteome in macrophages results in accumulation of high-molecular weight ubiquitinated proteins. (A) Immunoblots of RAW264.7 whole cell lysates following treatment with DUBinh (3.5 µM, 1 h), EerI (10 µM, 1 h) or MG132 (5 µM, 2 h) probed with specific antibodies for total mono- and poly-ubiquitinated proteins, K63-, K48- or linear M1-linked specific polyubiquitin chains and β-actin. The asterisk represents the free monoubiquitin. (B) RAW264.7 whole cell lysates were incubated with DUBinh-Biotin or ΔCN-biotin before immunoprecipitation using streptavidin-coated beads. The retained proteins were immunoblotted with antibodies for MYSM1 (95 kDa), DUBA (61 kDa), Ataxin3 (42 kDa), USP14 (60 kDa), UCH37 (37 kDa), Rpn11 (35 kDa), YOD1 (37 kDa) and USP25 (126 kDa). Data are representative of three independent experiments. Full-length immunoblots are presented in Supplementary Figs S6 and S7.
Figure 2
Figure 2
Inhibition of cellular DUBs in macrophages induces transient ROS generation. (A) FACS analysis of RAW264.7 cells treated with DUBinh for 0.5 h before staining with 5 µM CM-H2DCFDA. (B) Time course of ROS production in RAW264.7 following treatment with 3.5 µM DUBinh. The strategy used for the time course is depicted and representative plots are shown for each time point. (C) RAW264.7 cells were treated with DUBinh for 0.5 h before staining for ROS production as described above (treatment 1). Alternatively, treated macrophages were allowed to recovery for 4 h in media before a second challenge with 3.5 µM DUBinh. Cells were subsequently stained for ROS production (treatment 2). The left panels show representative histograms whereas the right panel shows the percentage of cells stained for ROS (% ROS+ cells) obtained from three independent experiments. The mean fluorescence intensity (MFI) and the percentage of ROS+ cells were calculated using FlowJo software. Significant differences were calculated using two-tailed Student’s t test or one-way ANOVA and Tukey’s multiple comparison test on the unmodified data (NS, not significant, *p < 0.05, ****p < 0.0001).
Figure 3
Figure 3
DUBinh promotes a ROS production that enhance macrophages antimicrobial effector mechanisms. (A) pBMDM incubated overnight with 100 ng/ml of LPS and INF-γ were treated for 0.5 h with 3.5 µM DUBinh before staining with ROS dye. Peritoneal macrophages (B) and splenocytes (C) were treated for 0.5 h with 1 µM DUBinh before staining with 1.25 µM and 2 µM CM-H2DCFDA, respectively. Subsequent staining of splenocytes with F4/80+ antibody was performed to label macrophages. (D) RAW264.7 cells were incubated with 10 mM NAC or medium only for 0.5 h. DUBinh was added on top at a final concentration of 3.5 µM for 0.5 h. Cells were infected with L. monocytogenes (MOI 1) for 0.5 h, washed and incubated for 6 h in medium containing 10 µg/ml of gentamicin before enumeration of intracellular bacteria. The data represent percent of intracellular L. monocytogenes growth compared to DMSO-only treated cells. (E) RAW264.7 cells were pre-treated with 10 mM NAC or medium in combination with 2.5 µM DUBinh C6 or equivalent volume of DMSO for 0.5 h before infection with MNV-1 (MOI 5) for 1 h on ice. Viral titers were determined from lysates harvested at 8 h p.i. All results are from at least three independent experiments. Significant differences were calculated using one-way ANOVA and Tukey’s multiple comparison test on the unmodified data (NS, not significant, **p < 0.01, ***p < 0.001).
Figure 4
Figure 4
Perturbation of p97 activity in macrophages induces ROS generation. (A) RAW264.7 cells were treated with 10 µM EerI for 1 h before staining with 5 µM CM-H2DCFDA. (B) Time course of ROS production in RAW264.7 following treatment with 10 µM EerI for 1 h. The MFI was calculated using FlowJo software. Peritoneal macrophages (C) and splenocytes (D) were treated for 1 h with 10 µM EerI before staining with 1.25 µM and 2 µM CM-H2DCFDA, respectively. Subsequent staining of splenocytes with F4/80+ antibody was performed to label macrophages. All FACS plots are representative of three independent experiments. (E) RAW264.7 cells were treated with 10 µM EerI for 1 h before infection with MNV-1 (MOI 5) for 1 h on ice. Viral titers were determined by counting plaque-forming units (PFU) from lysates harvested at 8 h p.i. (F) Whole cells lysates of RAW264.7 transfected with siRNA against p97 or a non-targeted control were analyzed by immunoblotting against p97. Full-length blots are presented in Supplementary Fig. 8C. Cell viability was determined using the WST-1 reagent and results represent the percent viability compared to NT control transfected cells. (H) At 30 h post-transfection, cells were stained with 5 µM CM-H2DCFDA for 0.5 h. The percentage of cells stained for ROS (% ROS+ cells) was obtained from two independent experiments. Significant differences were calculated using two-tailed Student’s t test or one-way ANOVA and Tukey’s multiple comparison test on the unmodified data (NS, not significant, *p < 0.05, **p < 0.01, ***p < 0.001). Full-length immunoblots are shown in Supplementary Fig. S7.
Figure 5
Figure 5
Inhibition of proteasome function is not sufficient to induce ROS generation in macrophages. (A) RAW264.7 cells were treated with 5 µM MG132 or 0.5 µM epoxomicin for 1 h before staining for ROS. (B) RAW264.7 cells were treated for 1 h with 100 µM IU1, a USP14-specific inhibitor, before staining for ROS. FACS plots are representative of 3 independent experiments. The left panels show representative histograms where right panels show the percentage of cells stained for ROS (% ROS+ cells) obtained from 3 independent experiments. Significant differences were calculated using one-way ANOVA and Tukey’s multiple comparison test on the unmodified data (NS, not significant, ***p < 0.001, ****p < 0.0001).
Figure 6
Figure 6
Perturbation of ubiquitin homeostasis in macrophages induces NADPH phagocyte oxidase-dependent ROS generation. (A) WT and gp91phox−/y iBMDM were treated for 0.5 h with 3.5 µM DUBinh or 10 µM EerI before staining for 0.5 h with 5 µM CM-H2DCFDA. Quantification of MFI from two independent experiments was calculated using FlowJo software. (B) WT and gp91phox−/y iBMDM were treated for 0.5 h with 3.5 µM DUBinh before infection with L. monocytogenes (MOI 1) for 0.5 h. Intracellular bacteria were enumerated at 6 h p.i. Data are from 3 independent experiments and, significant differences were calculated using one-way ANOVA with Tukey’s multiple comparison test (NS, not significant, **p < 0.01, ***p < 0.001, ****p < 0.0001).
Figure 7
Figure 7
Perturbation of ubiquitin homeostasis in macrophages promotes cytokine secretion. (A) RAW264.7 cells treated for 0.5 h with 3.5 µM DUBinh, followed by 6 h of incubation with 100 ng/ml of LPS were analyzed by qRT-PCR for Il6 and Tnfa transcripts. Data are from 3 independent experiments. (B) C56BL/6 mice were injected via intraperitoneal route with carrier control DMSO (n = 7), DUBinh 20 mg/kg (n = 8), carrier control and LPS 10 mg/kg (n = 10) or DUBinh and LPS (n = 10). Six hours later, sera were analyzed for IL-6 and TNF-α. Significant differences were calculated using two-tailed Student’s t test or one-way ANOVA with Tukey’s multiple comparison test (NS, not significant, **p < 0.01, ***p < 0.001, ****p < 0.0001, Student’s t test used).

Similar articles

Cited by

References

    1. Kieser KJ, Kagan JC. Multi-receptor detection of individual bacterial products by the innate immune system. Nat Rev Immunol. 2017;17:376–390. doi: 10.1038/nri.2017.25. - DOI - PMC - PubMed
    1. Keestra AM, et al. Manipulation of small Rho GTPases is a pathogen-induced process detected by NOD1. Nature. 2013;496:233–237. doi: 10.1038/nature12025. - DOI - PMC - PubMed
    1. Vance RE, Isberg RR, Portnoy DA. Patterns of pathogenesis: discrimination of pathogenic and nonpathogenic microbes by the innate immune system. Cell Host Microbe. 2009;6:10–21. doi: 10.1016/j.chom.2009.06.007. - DOI - PMC - PubMed
    1. Stuart LM, Paquette N, Boyer L. Effector-triggered versus pattern-triggered immunity: how animals sense pathogens. Nat Rev Immunol. 2013;13:199–206. doi: 10.1038/nri3398. - DOI - PMC - PubMed
    1. Liston A, Masters SL. Homeostasis-altering molecular processes as mechanisms of inflammasome activation. Nat Rev Immunol. 2017;17:208–214. doi: 10.1038/nri.2016.151. - DOI - PubMed

Publication types

LinkOut - more resources